# Technical Document Extraction: Attention over Values (a=128)
## Chart Overview
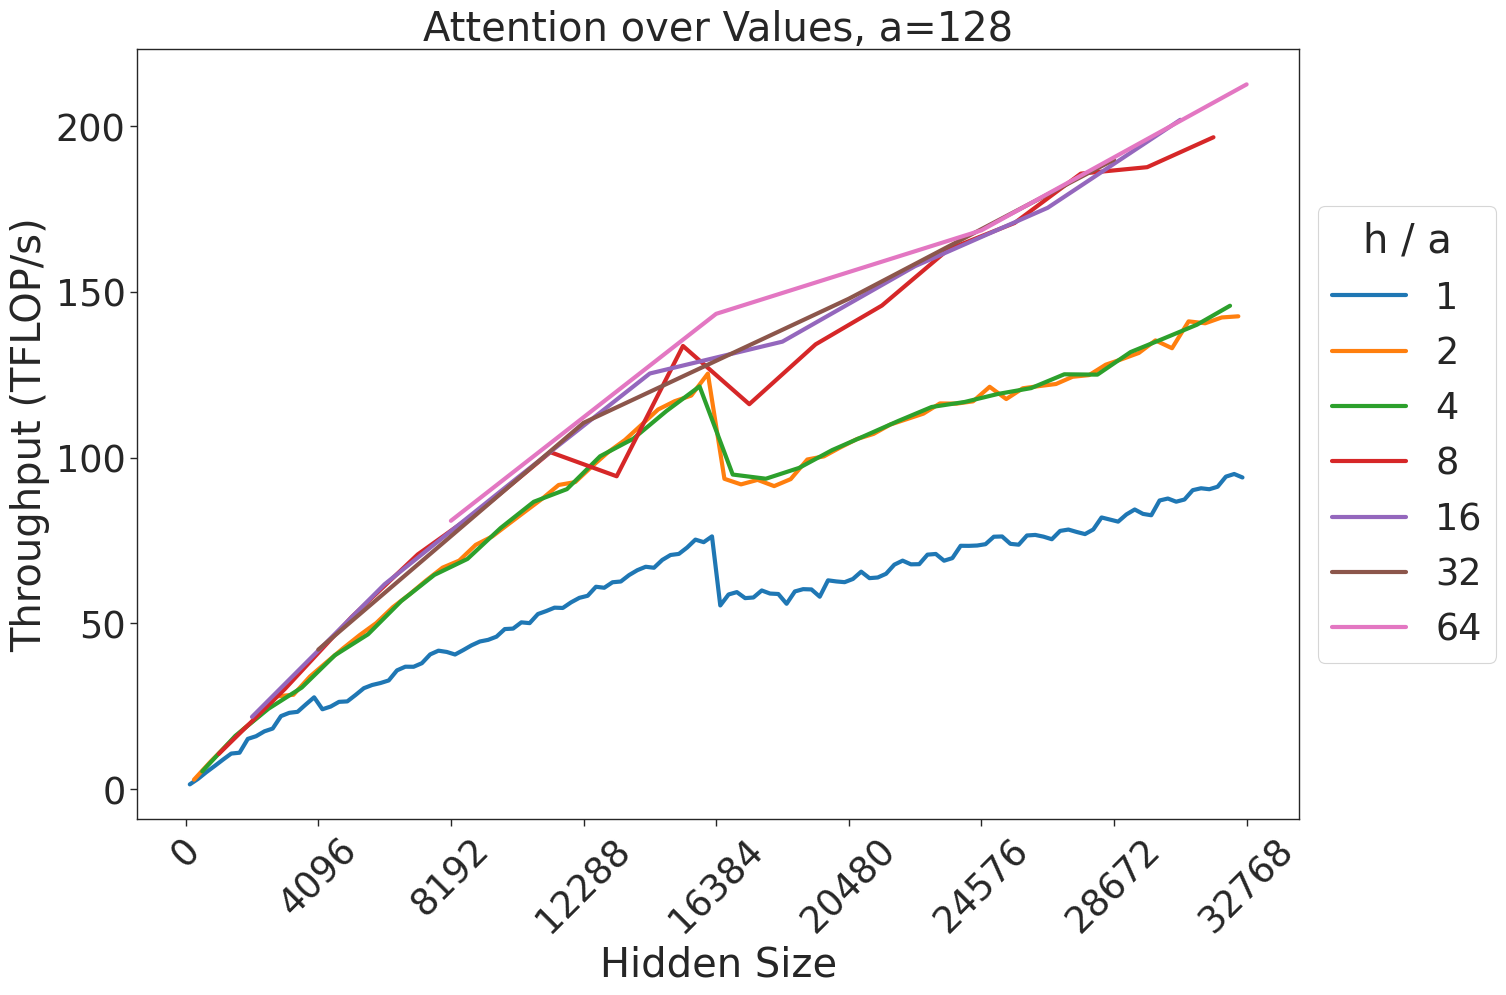
- **Title**: Attention over Values, a=128
- **Type**: Line graph
- **Purpose**: Visualizes throughput (TFLOP/s) across varying hidden sizes for different h/a ratios.
---
## Axis Labels and Markers
### X-Axis (Hidden Size)
- **Title**: Hidden Size
- **Range**: 0 to 32768
- **Markers**: 0, 4096, 8192, 12288, 16384, 20480, 24576, 28672, 32768
### Y-Axis (Throughput)
- **Title**: Throughput (TFLOP/s)
- **Range**: 0 to 200
- **Markers**: 0, 50, 100, 150, 200
---
## Legend
- **Position**: Right-aligned, top of the chart
- **Labels and Colors**:
- `h/a = 1` → Blue
- `h/a = 2` → Orange
- `h/a = 4` → Green
- `h/a = 8` → Red
- `h/a = 16` → Purple
- `h/a = 32` → Brown
- `h/a = 64` → Pink
---
## Data Series Analysis
### 1. **h/a = 1 (Blue Line)**
- **Trend**: Steady, linear increase from 0 to ~95 TFLOP/s at x=32768.
- **Key Points**:
- x=0: 0 TFLOP/s
- x=32768: ~95 TFLOP/s
### 2. **h/a = 2 (Orange Line)**
- **Trend**: Initial rise, dip at x=16384, then gradual increase.
- **Key Points**:
- x=0: 0 TFLOP/s
- x=16384: ~95 TFLOP/s
- x=32768: ~140 TFLOP/s
### 3. **h/a = 4 (Green Line)**
- **Trend**: Sharp rise, plateau at x=16384, then steady growth.
- **Key Points**:
- x=0: 0 TFLOP/s
- x=16384: ~100 TFLOP/s
- x=32768: ~145 TFLOP/s
### 4. **h/a = 8 (Red Line)**
- **Trend**: Rapid ascent, overtakes other lines after x=16384.
- **Key Points**:
- x=0: 0 TFLOP/s
- x=16384: ~120 TFLOP/s
- x=32768: ~195 TFLOP/s
### 5. **h/a = 16 (Purple Line)**
- **Trend**: Smooth, consistent growth, surpasses h/a=8 near x=24576.
- **Key Points**:
- x=0: 0 TFLOP/s
- x=24576: ~170 TFLOP/s
- x=32768: ~190 TFLOP/s
### 6. **h/a = 32 (Brown Line)**
- **Trend**: Steady increase, overtaken by h/a=16 near x=24576.
- **Key Points**:
- x=0: 0 TFLOP/s
- x=24576: ~160 TFLOP/s
- x=32768: ~185 TFLOP/s
### 7. **h/a = 64 (Pink Line)**
- **Trend**: Highest throughput, sharp upward trajectory.
- **Key Points**:
- x=0: 0 TFLOP/s
- x=28672: ~190 TFLOP/s
- x=32768: ~210 TFLOP/s
---
## Spatial Grounding
- **Legend Coordinates**: Right-aligned, top of the chart (exact [x, y] not specified in image).
- **Line Placement**: All lines originate at (0, 0) and extend to x=32768.
---
## Key Observations
1. **Throughput Scaling**: Higher h/a ratios generally achieve higher throughput, with diminishing returns observed for h/a=32 and h/a=64.
2. **Performance Peaks**: h/a=64 achieves the highest throughput (~210 TFLOP/s) at maximum hidden size.
3. **Divergence Points**: Lines for h/a=8, 16, and 32 intersect and diverge around x=16384–24576.
---
## Notes
- No embedded text or data tables present.
- All trends and data points are inferred from visual inspection of the line graph.
- No non-English text detected.