## Line Chart: Loss vs. Tokens (Trillion)
### Overview
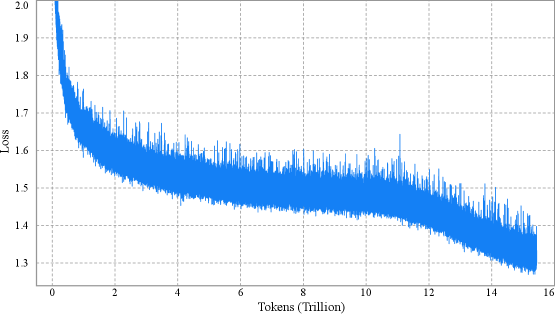
The image is a line chart showing the relationship between "Loss" and "Tokens (Trillion)". The blue line represents the loss value as the number of tokens increases. The chart shows a decreasing trend in loss as the model is trained on more tokens.
### Components/Axes
* **X-axis:** "Tokens (Trillion)" with markers at 0, 2, 4, 6, 8, 10, 12, 14, and 16.
* **Y-axis:** "Loss" with markers at 1.3, 1.4, 1.5, 1.6, 1.7, 1.8, 1.9, and 2.0.
* **Data Series:** A single blue line representing the loss.
### Detailed Analysis
* **X-Axis:** The x-axis represents the number of tokens used for training, measured in trillions. The scale ranges from 0 to 16 trillion tokens.
* **Y-Axis:** The y-axis represents the loss value, which is a measure of the error made by the model. The scale ranges from 1.3 to 2.0.
* **Data Series (Blue Line):**
* The blue line starts at approximately 2.0 loss at 0 tokens.
* It rapidly decreases to approximately 1.6 loss by 2 trillion tokens.
* It continues to decrease, but at a slower rate, reaching approximately 1.5 loss by 4 trillion tokens.
* The line fluctuates between approximately 1.4 and 1.6 loss between 4 and 12 trillion tokens.
* From 12 to 16 trillion tokens, the line shows a further decrease, reaching approximately 1.3 loss.
### Key Observations
* The loss decreases rapidly in the initial stages of training (0-2 trillion tokens).
* The rate of decrease slows down as the number of tokens increases.
* The loss fluctuates, indicating some variability in the training process.
* The loss appears to plateau after a certain number of tokens (around 12 trillion).
### Interpretation
The chart illustrates the training process of a machine learning model, where the loss decreases as the model is exposed to more data (tokens). The rapid initial decrease suggests that the model quickly learns the basic patterns in the data. The slower decrease and fluctuations later on indicate that the model is fine-tuning its parameters and encountering more complex patterns. The plateauing of the loss suggests that the model may be approaching its maximum performance on the given dataset or that further training may require adjustments to the model architecture or training parameters.