## Line Graph: Model Performance Loss Over Tokens
### Overview
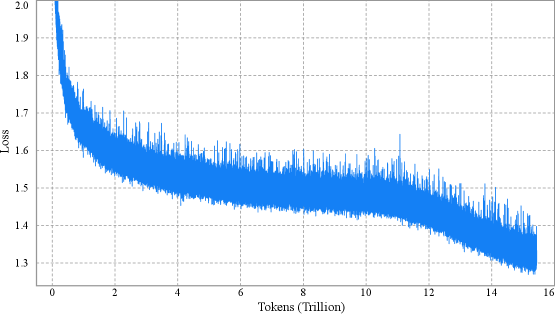
The image depicts a line graph illustrating the relationship between computational tokens (in trillions) and a metric labeled "Loss." The graph shows a sharp initial decline in loss, followed by a gradual stabilization with minor fluctuations. The y-axis ranges from 1.3 to 2.0, while the x-axis spans 0 to 16 trillion tokens.
### Components/Axes
- **X-Axis**: "Tokens (Trillion)" with grid markers at intervals of 2 trillion, labeled from 0 to 16 trillion.
- **Y-Axis**: "Loss" with grid markers at intervals of 0.1, labeled from 1.3 to 2.0.
- **Legend**: Located in the top-right corner, indicating a single data series:
- **Blue Line**: "Model Performance" (matches the plotted line).
- **Grid**: Light gray dashed lines for reference.
### Detailed Analysis
- **Initial Decline**:
- At 0 tokens, the loss starts at approximately **2.0**.
- By 2 trillion tokens, the loss drops sharply to **~1.5**, with a steep slope.
- Between 2 and 4 trillion tokens, the loss decreases further to **~1.4**, with minor oscillations.
- **Stabilization Phase**:
- From 4 to 14 trillion tokens, the loss fluctuates between **1.4 and 1.5**, with small spikes (e.g., ~1.55 at 10 trillion tokens).
- After 14 trillion tokens, the loss stabilizes near **1.3**, with reduced variability.
- **Noise**:
- Throughout the graph, the line exhibits minor "jitter" (e.g., ~1.45 at 6 trillion tokens), suggesting measurement variability or model adjustments.
### Key Observations
1. **Rapid Initial Improvement**: The steepest loss reduction occurs in the first 2 trillion tokens.
2. **Gradual Convergence**: Loss decreases by ~0.7 units (from 2.0 to 1.3) over 16 trillion tokens.
3. **Noise vs. Trend**: Fluctuations are small relative to the overall trend, indicating a stable model after initial training.
4. **Plateau Effect**: Loss stabilizes near 1.3 after 14 trillion tokens, suggesting diminishing returns.
### Interpretation
The graph demonstrates that the model's performance improves significantly as it processes more tokens, with loss decreasing sharply in the early stages and then converging to a stable value. The initial drop suggests rapid learning or optimization, while the plateau implies the model reaches a steady state where additional tokens yield minimal improvement. The minor fluctuations may reflect data noise, model fine-tuning, or external factors affecting training stability. This pattern is typical in machine learning, where early gains are substantial, but later progress requires exponentially more resources. The stabilization at ~1.3 loss indicates a potential optimal performance threshold for the model under the given conditions.