## Bar Chart: GPT-2 Model Performance Degradation by Layer Removal
### Overview
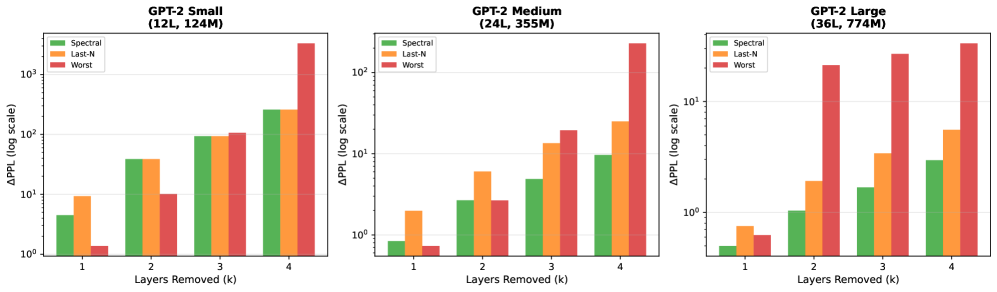
Three bar charts compare the impact of removing 1-4 layers on perplexity degradation (ΔPPL) for GPT-2 Small (12 layers, 124M parameters), Medium (24 layers, 355M), and Large (36 layers, 774M) models. Three methods are compared: Spectral (green), Last-N (orange), and Worst (red).
### Components/Axes
- **X-axis**: "Layers Removed (k)" with discrete values 1, 2, 3, 4
- **Y-axis**: "ΔPPL (log scale)" from 10^0 to 10^3
- **Legend**:
- Green = Spectral
- Orange = Last-N
- Red = Worst
- **Chart Layout**:
- Legend positioned top-left
- Y-axis uses logarithmic scale (10^0, 10^1, 10^2, 10^3)
- Each model size has a separate chart
### Detailed Analysis
#### GPT-2 Small (12L, 124M)
- **Spectral (green)**:
- 1 layer: ~10^{0.5}
- 2 layers: ~10^1
- 3 layers: ~10^{1.5}
- 4 layers: ~10^2
- **Last-N (orange)**:
- 1 layer: ~10^1
- 2 layers: ~10^1
- 3 layers: ~10^{1.5}
- 4 layers: ~10^2
- **Worst (red)**:
- 1 layer: ~10^{0.2}
- 2 layers: ~10^1
- 3 layers: ~10^{1.5}
- 4 layers: ~10^3
#### GPT-2 Medium (24L, 355M)
- **Spectral (green)**:
- 1 layer: ~10^0
- 2 layers: ~10^{0.5}
- 3 layers: ~10^1
- 4 layers: ~10^{1.5}
- **Last-N (orange)**:
- 1 layer: ~10^{0.5}
- 2 layers: ~10^1
- 3 layers: ~10^{1.5}
- 4 layers: ~10^2
- **Worst (red)**:
- 1 layer: ~10^0
- 2 layers: ~10^1
- 3 layers: ~10^2
- 4 layers: ~10^3
#### GPT-2 Large (36L, 774M)
- **Spectral (green)**:
- 1 layer: ~10^0
- 2 layers: ~10^{0.5}
- 3 layers: ~10^1
- 4 layers: ~10^{1.5}
- **Last-N (orange)**:
- 1 layer: ~10^{0.5}
- 2 layers: ~10^1
- 3 layers: ~10^{1.5}
- 4 layers: ~10^2
- **Worst (red)**:
- 1 layer: ~10^0
- 2 layers: ~10^1
- 3 layers: ~10^2
- 4 layers: ~10^3
### Key Observations
1. **Layer Removal Impact**: ΔPPL increases exponentially with more layers removed across all models and methods.
2. **Method Performance**:
- **Spectral** consistently shows the lowest ΔPPL, especially in larger models.
- **Last-N** performs better than Worst but worse than Spectral.
- **Worst** method exhibits the most severe degradation, particularly in the Large model (ΔPPL jumps to 10^3 when 4 layers are removed).
3. **Model Size Correlation**: Larger models show steeper ΔPPL increases, suggesting greater sensitivity to layer removal.
### Interpretation
The data demonstrates that layer removal degrades model performance, with the **Worst** method being most vulnerable. The **Spectral** method exhibits robustness, maintaining lower ΔPPL across all model sizes. The exponential ΔPPL growth in larger models highlights architectural trade-offs: while larger models have greater capacity, they may be more fragile to structural modifications. The **Last-N** method's intermediate performance suggests a middle-ground approach, though its effectiveness diminishes with scale. Notably, the Worst method's catastrophic failure in the Large model (ΔPPL=10^3) underscores the importance of careful layer selection in model pruning.