## Step Plot: Algorithm Performance Comparison
### Overview
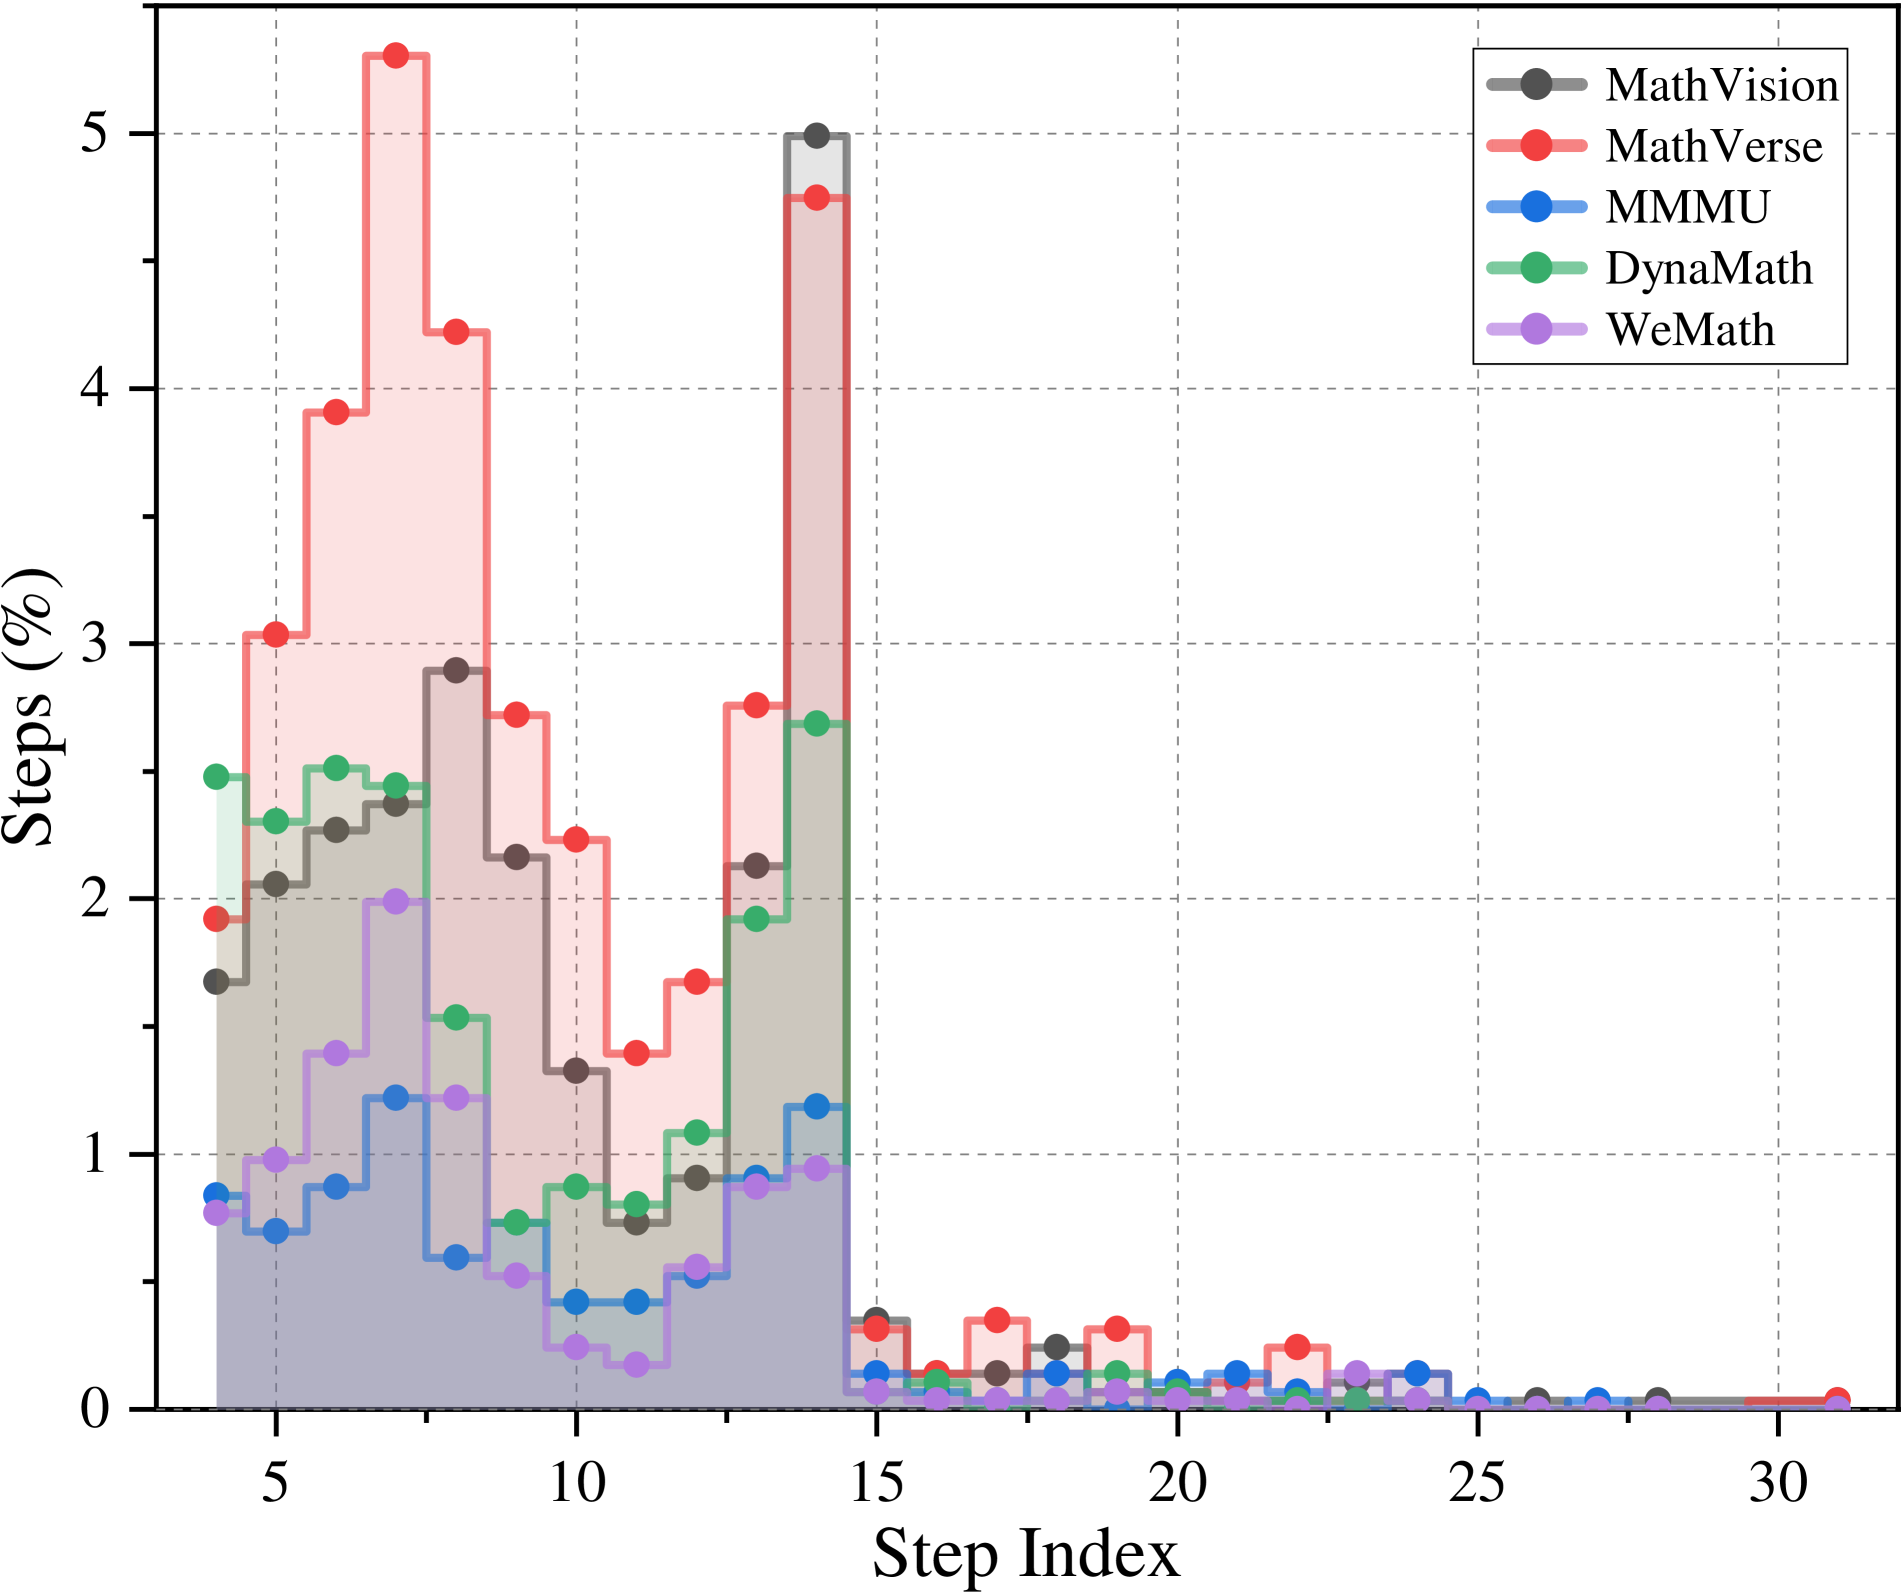
The image is a step plot comparing the performance of five different algorithms (MathVision, MathVerse, MMMU, DynaMath, and WeMath) across a range of step indices. The y-axis represents the percentage of steps, and the x-axis represents the step index. The plot shows how the percentage of steps varies for each algorithm as the step index increases.
### Components/Axes
* **X-axis:** Step Index, ranging from 0 to 30. Axis markers are present at intervals of 5 (5, 10, 15, 20, 25, 30).
* **Y-axis:** Steps (%), ranging from 0 to 5. Axis markers are present at intervals of 1 (1, 2, 3, 4, 5).
* **Legend (Top-Right):**
* MathVision (Gray)
* MathVerse (Red)
* MMMU (Blue)
* DynaMath (Green)
* WeMath (Purple)
### Detailed Analysis or ### Content Details
**MathVision (Gray):**
* Trend: Initially increases, peaks around step index 14, then decreases.
* Step Index 4: ~1.7%
* Step Index 6: ~2.3%
* Step Index 8: ~2.4%
* Step Index 10: ~1.6%
* Step Index 12: ~2.1%
* Step Index 14: ~5.0%
* Step Index 16: ~0.3%
* Step Index 18: ~0.3%
* Step Index 20: ~0.2%
* Step Index 22: ~0.1%
* Step Index 24: ~0.1%
* Step Index 26: ~0.0%
* Step Index 28: ~0.0%
* Step Index 30: ~0.0%
**MathVerse (Red):**
* Trend: Initially increases sharply, peaks around step index 7, then decreases.
* Step Index 4: ~1.9%
* Step Index 6: ~3.9%
* Step Index 8: ~5.3%
* Step Index 10: ~4.2%
* Step Index 12: ~2.7%
* Step Index 14: ~1.4%
* Step Index 16: ~0.3%
* Step Index 18: ~0.3%
* Step Index 20: ~0.2%
* Step Index 22: ~0.2%
* Step Index 24: ~0.1%
* Step Index 26: ~0.1%
* Step Index 28: ~0.0%
* Step Index 30: ~0.1%
**MMMU (Blue):**
* Trend: Generally low, with a small peak around step index 12, then decreases.
* Step Index 4: ~0.8%
* Step Index 6: ~0.7%
* Step Index 8: ~1.2%
* Step Index 10: ~0.5%
* Step Index 12: ~1.2%
* Step Index 14: ~0.8%
* Step Index 16: ~0.1%
* Step Index 18: ~0.1%
* Step Index 20: ~0.1%
* Step Index 22: ~0.1%
* Step Index 24: ~0.1%
* Step Index 26: ~0.0%
* Step Index 28: ~0.0%
* Step Index 30: ~0.0%
**DynaMath (Green):**
* Trend: Relatively stable initially, peaks around step index 7, then decreases.
* Step Index 4: ~2.5%
* Step Index 6: ~2.3%
* Step Index 8: ~2.5%
* Step Index 10: ~1.5%
* Step Index 12: ~0.7%
* Step Index 14: ~2.7%
* Step Index 16: ~0.2%
* Step Index 18: ~0.1%
* Step Index 20: ~0.1%
* Step Index 22: ~0.0%
* Step Index 24: ~0.0%
* Step Index 26: ~0.0%
* Step Index 28: ~0.0%
* Step Index 30: ~0.0%
**WeMath (Purple):**
* Trend: Increases initially, peaks around step index 6, then decreases.
* Step Index 4: ~0.8%
* Step Index 6: ~1.6%
* Step Index 8: ~1.3%
* Step Index 10: ~0.5%
* Step Index 12: ~0.3%
* Step Index 14: ~0.2%
* Step Index 16: ~0.1%
* Step Index 18: ~0.1%
* Step Index 20: ~0.1%
* Step Index 22: ~0.0%
* Step Index 24: ~0.0%
* Step Index 26: ~0.0%
* Step Index 28: ~0.0%
* Step Index 30: ~0.0%
### Key Observations
* MathVerse has the highest percentage of steps at its peak, reaching approximately 5.3% at step index 8.
* MathVision has a later peak at step index 14, reaching approximately 5.0%.
* MMMU, DynaMath, and WeMath generally have lower percentages of steps compared to MathVision and MathVerse.
* All algorithms show a decreasing trend in the percentage of steps as the step index increases beyond their respective peaks.
* The percentage of steps for all algorithms converges towards 0 as the step index approaches 30.
### Interpretation
The step plot illustrates the performance of different algorithms in terms of the percentage of steps they take across a range of step indices. MathVerse and MathVision appear to be more active in the earlier steps, with higher percentages, while MMMU, DynaMath, and WeMath are less active. The fact that all algorithms converge towards 0 at higher step indices suggests that they become less relevant or effective as the step index increases. The choice of algorithm may depend on the specific requirements of the task and the importance of performance at different step indices.