\n
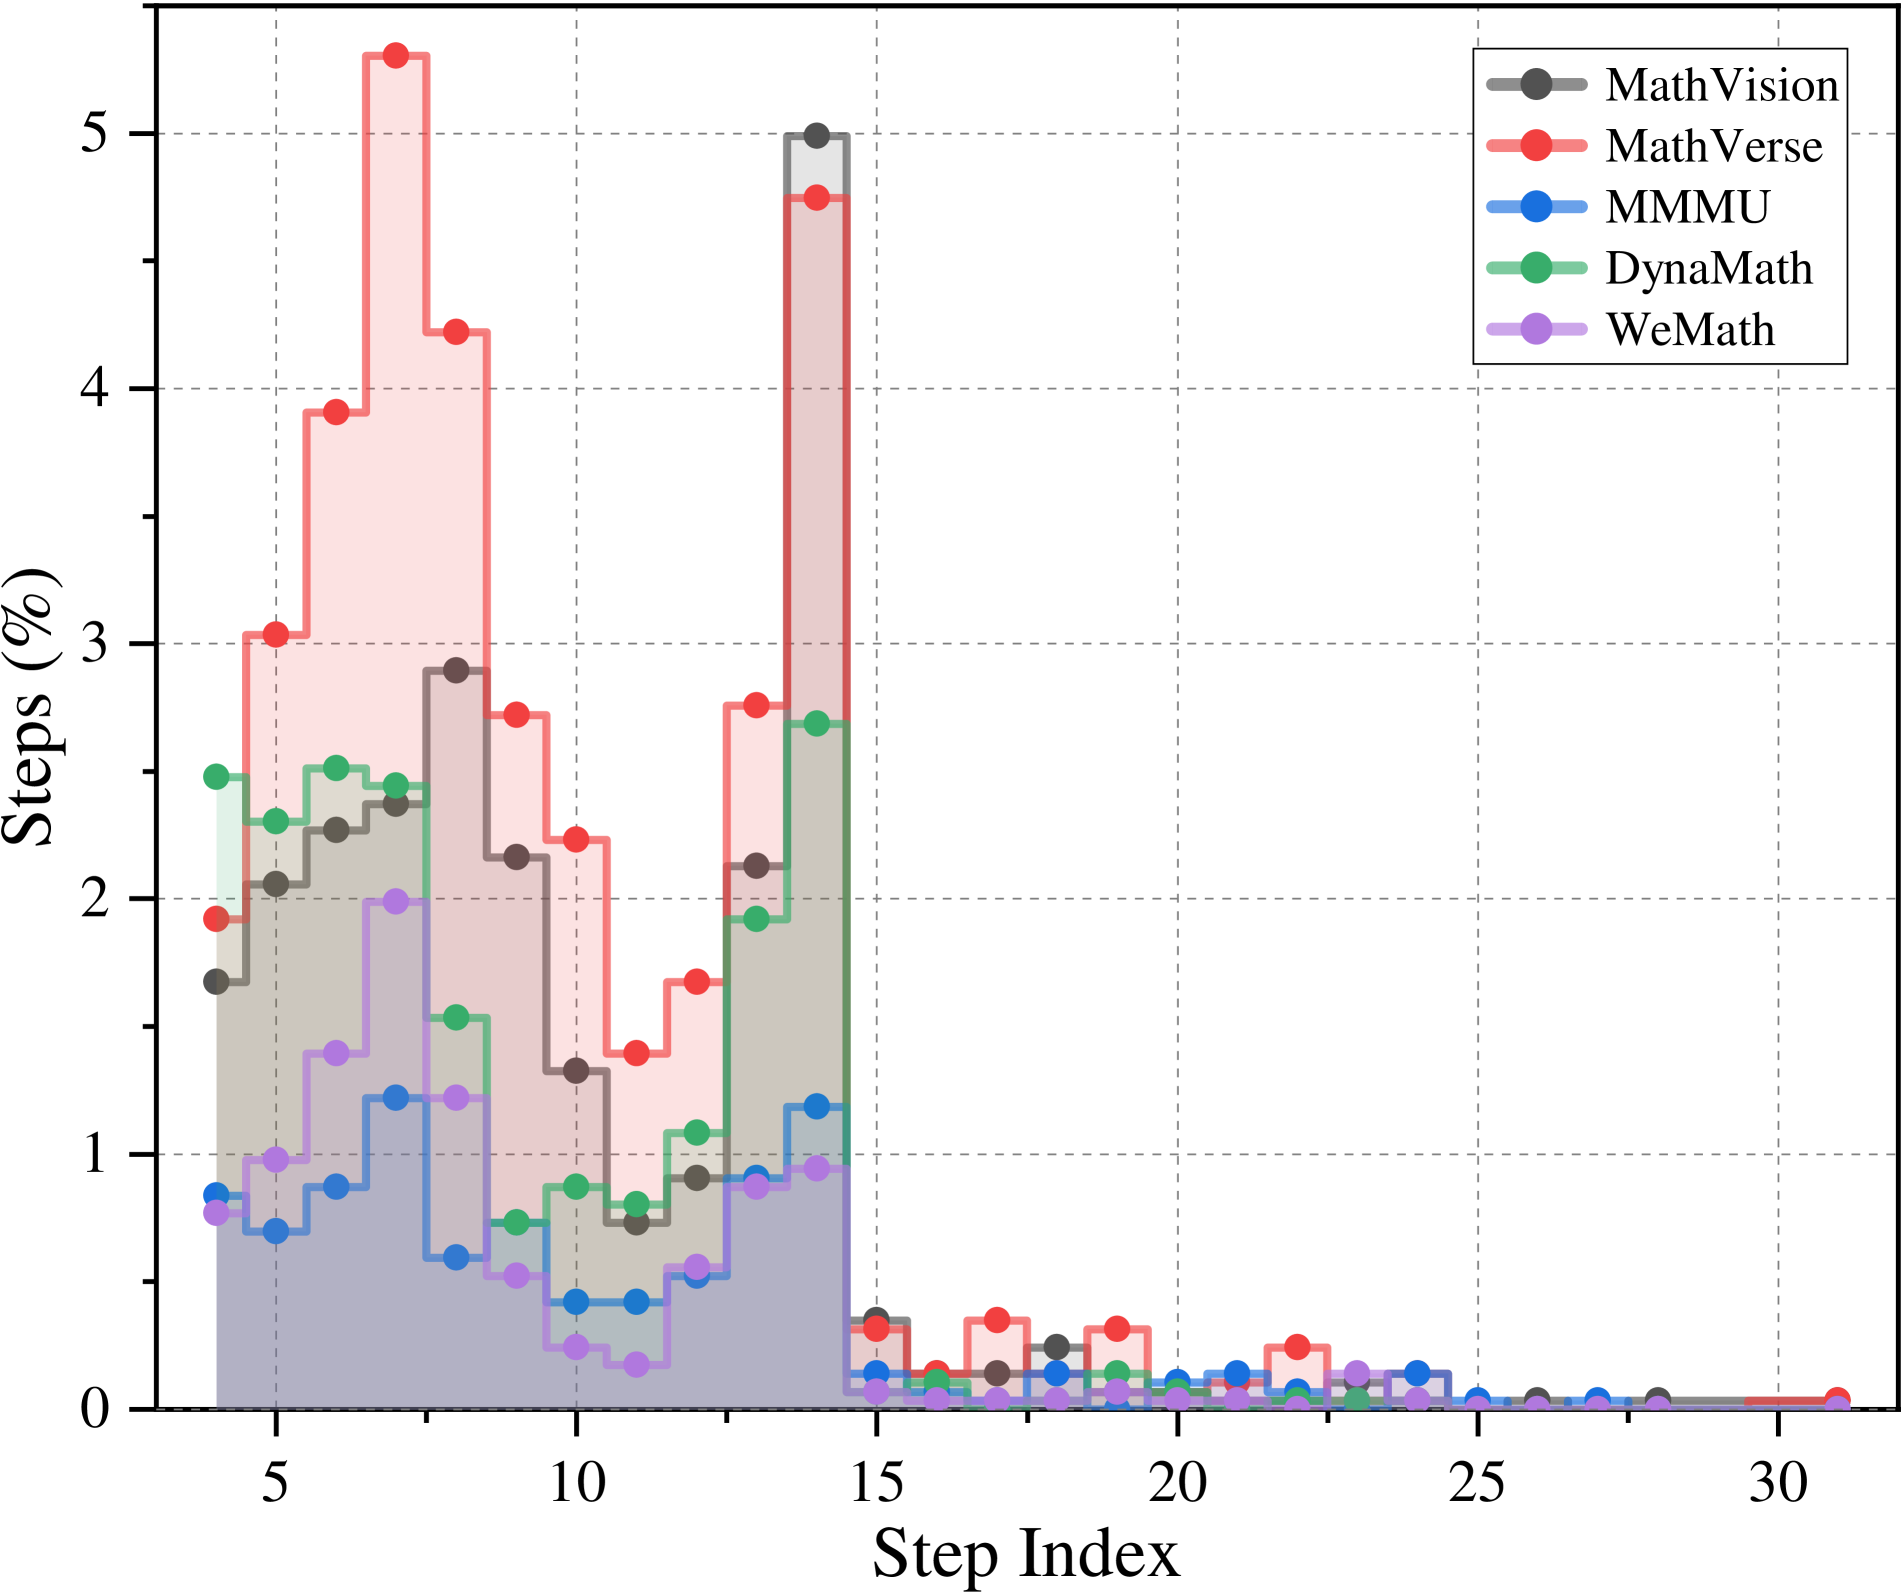
## Step Distribution Chart: Percentage of Steps by Index for Five Math Datasets
### Overview
This image is a step plot (or staircase line chart) displaying the distribution of "Steps (%)" across a "Step Index" for five distinct datasets. The chart visualizes how frequently problems or tasks of a certain step length (index) occur within each dataset, expressed as a percentage of the total. The data is heavily concentrated in the lower step indices (approximately 0-15), with a sharp decline thereafter.
### Components/Axes
* **Y-Axis:** Labeled **"Steps (%)"**. Scale ranges from 0 to 5, with major grid lines at intervals of 1. The axis represents the percentage of problems/steps in the dataset that correspond to a given step index.
* **X-Axis:** Labeled **"Step Index"**. Scale ranges from 0 to 30, with major ticks and labels at 5, 10, 15, 20, 25, and 30. The axis represents the sequential step number or problem length.
* **Legend:** Positioned in the **top-right corner** of the chart area. It contains five entries, each with a colored line and marker:
* **MathVision:** Dark gray line with circle markers.
* **MathVerse:** Red line with circle markers.
* **MMMU:** Blue line with circle markers.
* **DynaMath:** Green line with circle markers.
* **WeMath:** Purple line with circle markers.
* **Plot Area:** Features a light gray background with a dashed grid. Each dataset is represented by a colored step line and a semi-transparent shaded area of the same color beneath it.
### Detailed Analysis
The chart shows the percentage distribution of step counts for each dataset. The trend for all datasets is a concentration of data in the early step indices (roughly 4-15), followed by a long tail of very low percentages extending to index 30.
**Trend Verification & Data Points (Approximate Values):**
* **MathVerse (Red):** Exhibits the highest peaks. It rises sharply from index 4, reaching a major peak of **~5.3%** at index 7. It has another significant peak of **~4.8%** at index 14. The trend shows high variability in the early indices before dropping below 0.5% after index 15.
* **MathVision (Dark Gray):** Follows a similar pattern to MathVerse but with slightly lower peaks. Its highest point is **~5.0%** at index 14, closely matching MathVerse's second peak. It also shows a notable peak of **~2.9%** at index 8.
* **DynaMath (Green):** Shows moderate peaks. Its highest values are around **2.5-2.7%** in the index 4-8 range and again at index 14 (**~2.7%**).
* **MMMU (Blue):** Has the lowest overall percentages among the five. Its values generally stay below 1.5%, with a modest peak of **~1.2%** around index 7 and index 14.
* **WeMath (Purple):** Also has low percentages, similar to MMMU. It peaks at **~2.0%** at index 7 and shows a smaller peak of **~1.0%** at index 14.
**Spatial Grounding & Key Regions:**
1. **Primary Cluster (Indices 4-15):** This region contains all significant data mass. The lines for MathVerse and MathVision are consistently the highest, followed by DynaMath, then MMMU and WeMath.
2. **Secondary Cluster (Indices 15-30):** All datasets show a dramatic drop after index 15. Values in this region are uniformly low, mostly fluctuating between **0.0% and 0.4%**, forming a long tail.
3. **Notable Synchronization:** All five datasets show a pronounced local peak or step-up at **index 14**, suggesting a common characteristic or benchmark problem length across these collections.
### Key Observations
1. **Bimodal Distribution:** The data for the top datasets (MathVerse, MathVision) suggests a bimodal distribution with major concentrations around step indices 7-8 and 14-15.
2. **Sharp Cutoff:** There is a distinct and sharp decline in frequency for all datasets after step index 15. Problems requiring more than 15 steps are rare (<0.5%) in these collections.
3. **Dataset Hierarchy:** A clear hierarchy in step-count frequency is visible: MathVerse ≥ MathVision > DynaMath > MMMU ≈ WeMath. This implies MathVerse and MathVision contain a higher proportion of problems requiring a moderate number of steps (7-15).
4. **Common Anomaly at Index 14:** The synchronized peak at index 14 across all datasets is a significant anomaly, indicating this specific step length is disproportionately common.
### Interpretation
This chart likely analyzes the complexity or length of problems within different multimodal mathematical reasoning datasets. The "Step Index" probably corresponds to the number of reasoning steps required to solve a problem.
* **What the data suggests:** The datasets are not uniformly distributed across problem lengths. Instead, they are heavily skewed towards problems solvable in under 15 steps, with specific "sweet spots" around 7-8 and 14-15 steps. This could reflect dataset construction biases, the inherent nature of the mathematical problems included, or a focus on evaluating models on problems of a certain manageable complexity.
* **Relationship between elements:** The high correlation in the shape of the distributions (especially the peaks at 7 and 14) suggests these datasets may share similar sources, problem types, or design philosophies. The difference in magnitude (e.g., MathVerse being higher) indicates varying concentrations of these mid-length problems.
* **Notable implications:** The sharp cutoff after 15 steps implies these benchmarks may not effectively test a model's ability to handle very long, complex reasoning chains (20+ steps). The pronounced peak at 14 steps could be an artifact—perhaps a common template or a standard problem type that naturally requires 14 steps to solve. Researchers using these datasets should be aware that model performance might be heavily influenced by its ability to handle problems in the 7-15 step range.