## Line Graph: h_p ← pattern₀(X) ∧ region₁(X) (p = 1, r = 1)
### Overview
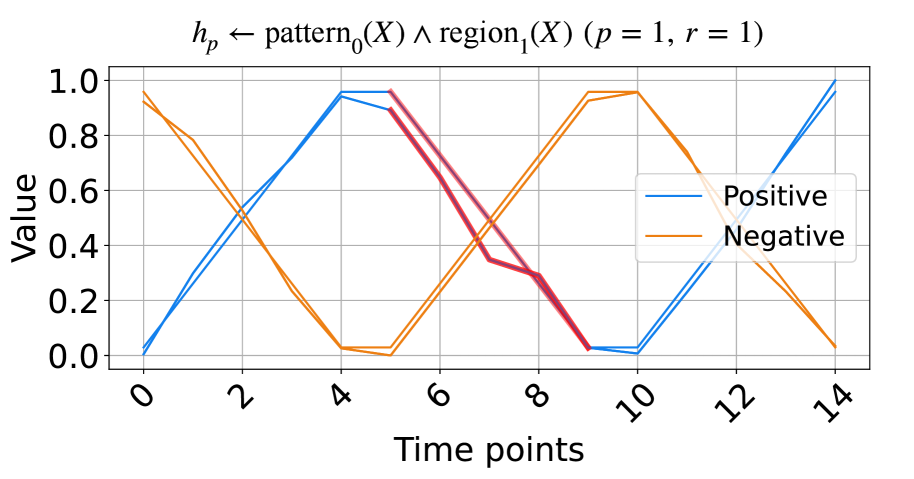
The image depicts a line graph comparing two opposing trends labeled "Positive" (blue) and "Negative" (orange) across 15 time points (0–14). The graph includes a legend in the top-right corner and a title referencing a logical relationship between pattern and region functions with parameters p=1 and r=1.
### Components/Axes
- **X-axis**: "Time points" (0, 2, 4, 6, 8, 10, 12, 14)
- **Y-axis**: "Value" (0.0 to 1.0 in 0.2 increments)
- **Legend**: Top-right corner, with blue = "Positive", orange = "Negative"
- **Title**: "h_p ← pattern₀(X) ∧ region₁(X) (p = 1, r = 1)" (top-center)
### Detailed Analysis
1. **Positive Line (Blue)**:
- Starts at 0.0 (time 0)
- Rises sharply to ~1.0 at time 4
- Drops to 0.0 at time 8
- Rises again to ~1.0 at time 14
- Crosses the Negative line at ~time 2, 6, and 10
2. **Negative Line (Orange)**:
- Starts at ~0.9 at time 0
- Drops to 0.0 at time 4
- Rises to ~1.0 at time 8
- Drops to 0.0 at time 14
- Crosses the Positive line at ~time 2, 6, and 10
3. **Key Intersection Points**:
- Time 2: Positive ~0.4, Negative ~0.6
- Time 6: Positive ~0.8, Negative ~0.2
- Time 10: Positive ~0.0, Negative ~0.9
### Key Observations
- The lines exhibit **inverse proportionality**: when one peaks, the other troughs.
- Both lines reach 0.0 at distinct time points (Positive at 0, 8, 14; Negative at 4, 14).
- The graph suggests a **cyclical or alternating pattern** between positive and negative states.
### Interpretation
The data demonstrates a **binary opposition** between "Positive" and "Negative" values over time, with strict alternation between states. The parameters p=1 and r=1 in the title may indicate a simplified model (e.g., binary classification or threshold-based system). The intersections at times 2, 6, and 10 suggest critical transition points where the system switches states. The absence of intermediate values (e.g., 0.5) implies a **digital rather than analog** representation of the data. This could reflect a theoretical framework where opposing forces (e.g., activation/inhibition, presence/absence) dominate at discrete intervals.