## [Grouped Bar Chart]: Llama3-8B-Instruct Defense Evaluation
### Overview
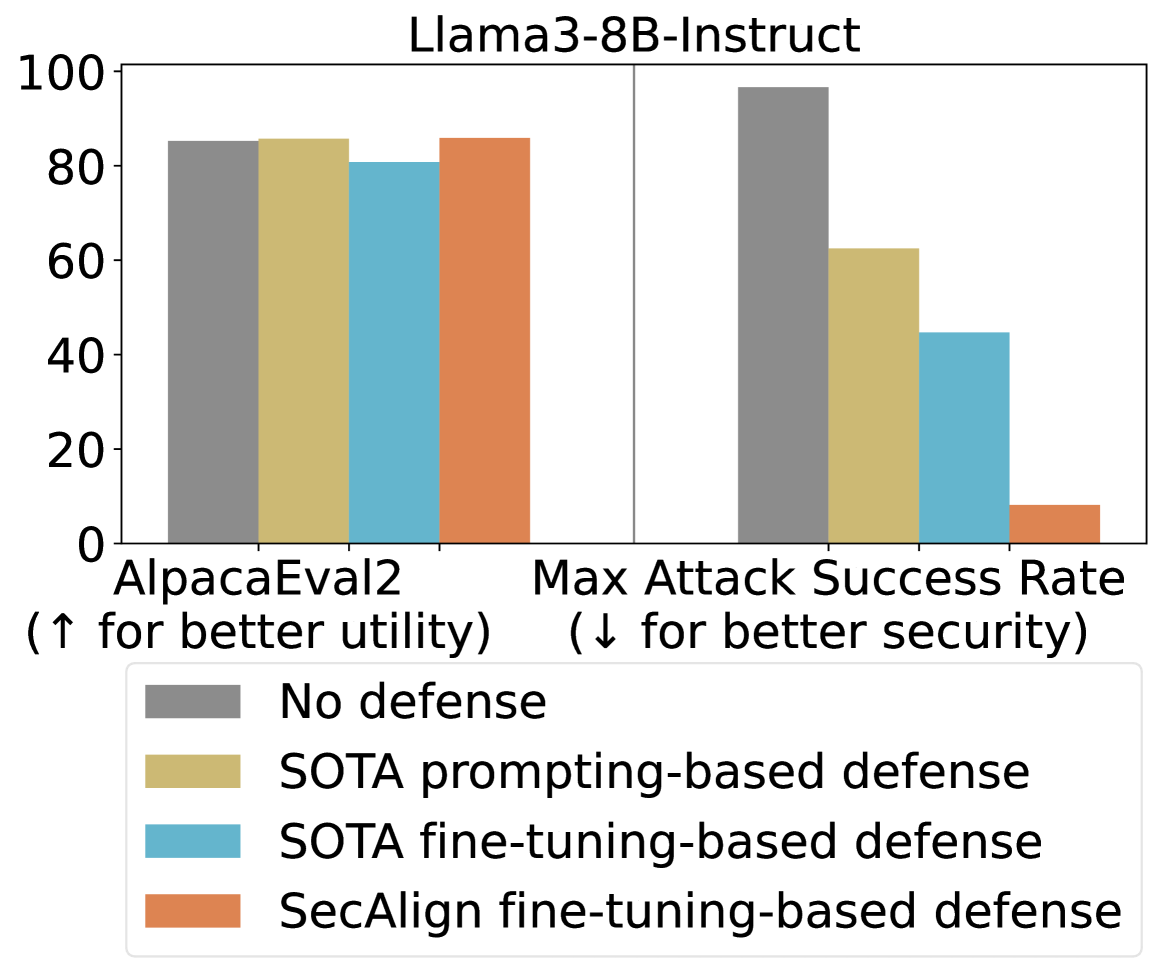
This image is a grouped bar chart titled "Llama3-8B-Instruct". It compares the performance of four different defense mechanisms against two key metrics: utility (AlpacaEval2) and security (Max Attack Success Rate). The chart visually demonstrates the trade-off between model helpfulness and its resilience to attacks.
### Components/Axes
* **Title:** "Llama3-8B-Instruct" (Top center).
* **Y-Axis:** A numerical scale from 0 to 100, representing percentage scores. Major tick marks are at 0, 20, 40, 60, 80, 100.
* **X-Axis:** Two primary categories, each containing a group of four bars.
1. **Left Group Label:** "AlpacaEval2 (↑ for better utility)"
2. **Right Group Label:** "Max Attack Success Rate (↓ for better security)"
* **Legend:** Located at the bottom center of the chart. It maps colors to defense methods:
* **Grey:** "No defense"
* **Yellow/Tan:** "SOTA prompting-based defense"
* **Light Blue:** "SOTA fine-tuning-based defense"
* **Orange:** "SecAlign fine-tuning-based defense"
### Detailed Analysis
**1. AlpacaEval2 (Utility - Higher is Better):**
* **Trend:** All four bars are relatively high and close in value, indicating that the defenses have a minimal negative impact on the model's general utility as measured by this benchmark.
* **Data Points (Approximate):**
* **No defense (Grey):** ~85%
* **SOTA prompting-based defense (Yellow):** ~86%
* **SOTA fine-tuning-based defense (Blue):** ~81%
* **SecAlign fine-tuning-based defense (Orange):** ~86%
**2. Max Attack Success Rate (Security - Lower is Better):**
* **Trend:** There is a clear, descending stair-step pattern from left to right. Each subsequent defense method shows a significant reduction in attack success rate.
* **Data Points (Approximate):**
* **No defense (Grey):** ~97% (Very high vulnerability)
* **SOTA prompting-based defense (Yellow):** ~62%
* **SOTA fine-tuning-based defense (Blue):** ~44%
* **SecAlign fine-tuning-based defense (Orange):** ~8% (Very low vulnerability)
### Key Observations
* **Trade-off Visualization:** The chart effectively illustrates the core challenge in AI safety: maintaining utility while improving security. The "No defense" baseline has high utility but catastrophic security.
* **Defense Efficacy:** There is a dramatic and consistent improvement in security (lower attack success rate) as one moves from no defense, to prompting-based, to standard fine-tuning, and finally to the SecAlign fine-tuning defense.
* **Utility Preservation:** Notably, the "SecAlign fine-tuning-based defense" (Orange) achieves the best security score (~8%) while maintaining a utility score (~86%) that is on par with or slightly better than the "No defense" baseline. This suggests it successfully mitigates the typical utility-security trade-off.
* **SOTA Comparison:** The "SOTA fine-tuning-based defense" (Blue) offers better security than the prompting-based version but at a slight cost to utility (the lowest AlpacaEval2 score of the group).
### Interpretation
This chart presents a compelling case for the effectiveness of the "SecAlign fine-tuning-based defense" method. The data suggests that this specific fine-tuning approach can successfully "align" a model for security without sacrificing its general helpfulness or capability.
The progression from left to right in the "Max Attack Success Rate" group tells a story of iterative improvement in defensive techniques. The near-elimination of successful attacks (from ~97% down to ~8%) by the SecAlign method, while keeping utility high, indicates a significant advancement in creating robust and safe AI systems. The chart implies that advanced, security-focused fine-tuning (like SecAlign) is a superior strategy to prompting-based defenses or standard fine-tuning for protecting models like Llama3-8B-Instruct against attacks.