## Bar Chart: Correctness Percentage by Method
### Overview
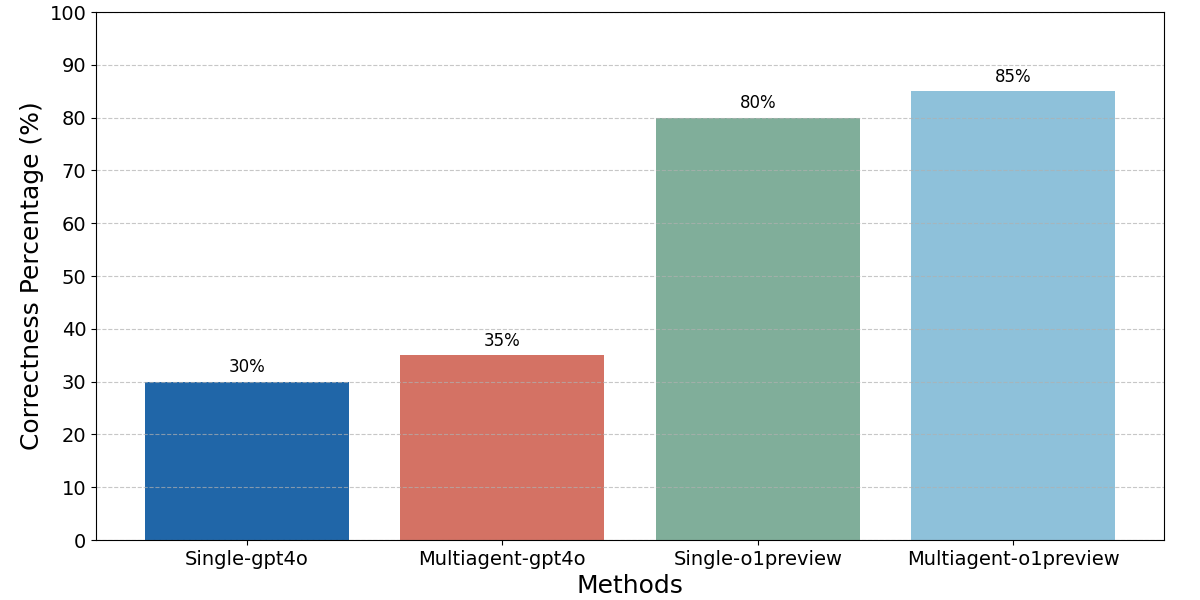
The image is a bar chart comparing the correctness percentage of four different methods: Single-gpt4o, Multiagent-gpt4o, Single-o1preview, and Multiagent-o1preview. The y-axis represents the correctness percentage, ranging from 0% to 100%. The x-axis represents the methods being compared.
### Components/Axes
* **X-axis:** Methods (Single-gpt4o, Multiagent-gpt4o, Single-o1preview, Multiagent-o1preview)
* **Y-axis:** Correctness Percentage (%), with ticks at intervals of 10 from 0 to 100.
* **Title:** Implicitly, the chart compares the correctness of different methods.
* **Gridlines:** Horizontal gridlines are present at each 10% interval on the y-axis.
### Detailed Analysis
* **Single-gpt4o (Dark Blue):** The correctness percentage is 30%.
* **Multiagent-gpt4o (Red):** The correctness percentage is 35%.
* **Single-o1preview (Green):** The correctness percentage is 80%.
* **Multiagent-o1preview (Light Blue):** The correctness percentage is 85%.
### Key Observations
* The 'o1preview' methods (Single and Multiagent) significantly outperform the 'gpt4o' methods.
* The Multiagent versions of both 'gpt4o' and 'o1preview' show a slight improvement in correctness percentage compared to their single-agent counterparts.
### Interpretation
The bar chart suggests that the 'o1preview' methods are more effective than the 'gpt4o' methods in terms of correctness. Furthermore, using a multiagent approach seems to provide a marginal improvement in correctness for both types of methods. The difference in performance between 'gpt4o' and 'o1preview' is substantial, indicating a significant difference in the underlying algorithms or models used by these methods. The data highlights the importance of method selection for achieving higher correctness percentages.