## Bar Chart: Correctness Percentage Comparison Across Methods
### Overview
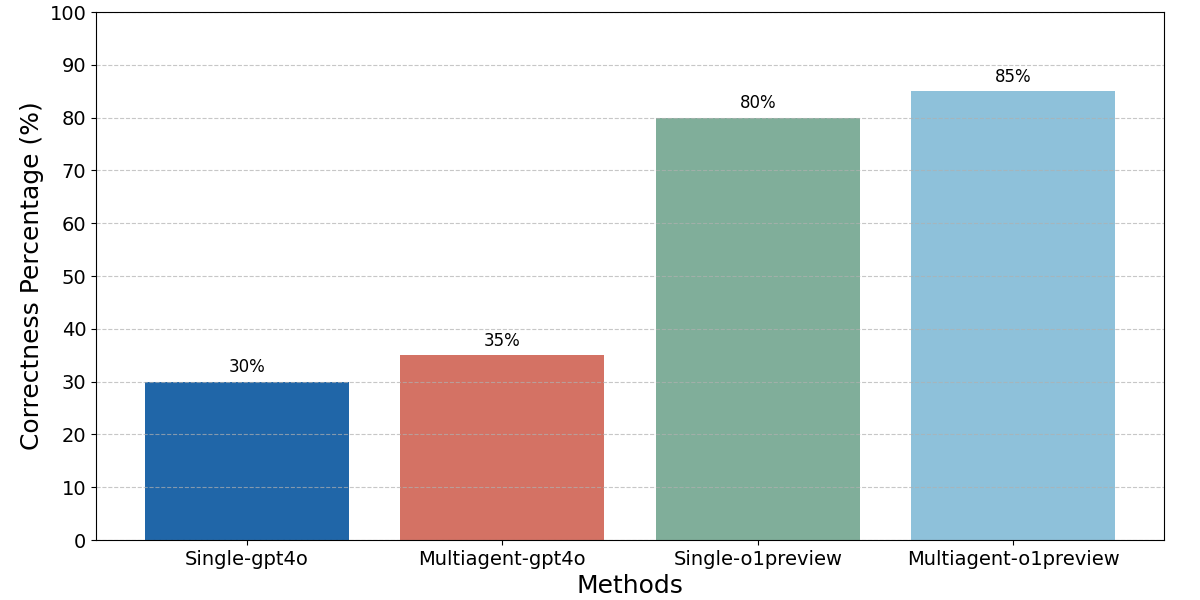
The chart compares the correctness percentages of four methods: Single-gpt4o, Multiagent-gpt4o, Single-o1preview, and Multiagent-o1preview. The y-axis represents correctness percentage (0–100%), while the x-axis lists the methods. Four vertical bars visualize the performance, with colors corresponding to each method as defined in the legend.
### Components/Axes
- **X-axis (Methods)**:
- Single-gpt4o (blue)
- Multiagent-gpt4o (red)
- Single-o1preview (green)
- Multiagent-o1preview (light blue)
- **Y-axis (Correctness Percentage)**: Labeled "Correctness Percentage (%)" with ticks at 0, 10, 20, ..., 100.
- **Legend**: Located at the bottom, mapping colors to methods:
- Blue: Single-gpt4o
- Red: Multiagent-gpt4o
- Green: Single-o1preview
- Light blue: Multiagent-o1preview
### Detailed Analysis
- **Single-gpt4o**: Blue bar at 30% correctness.
- **Multiagent-gpt4o**: Red bar at 35% correctness.
- **Single-o1preview**: Green bar at 80% correctness.
- **Multiagent-o1preview**: Light blue bar at 85% correctness.
### Key Observations
1. **Performance Gradient**: Correctness increases significantly from Single-gpt4o (30%) to Multiagent-o1preview (85%).
2. **Multiagent Advantage**: Multiagent methods (Multiagent-gpt4o and Multiagent-o1preview) outperform their single-agent counterparts by 5% and 5%, respectively.
3. **Model Version Impact**: Transitioning from gpt4o to o1preview (e.g., Single-o1preview vs. Single-gpt4o) results in a 50% correctness improvement.
4. **Synergy Effect**: Combining multiagent approaches with o1preview (Multiagent-o1preview) achieves the highest performance (85%).
### Interpretation
The data suggests that multiagent systems and advanced model versions (o1preview) synergistically enhance correctness. The 50% jump from gpt4o to o1preview indicates architectural or training improvements in the o1preview model. Multiagent frameworks further amplify these gains, likely through collaborative problem-solving or resource sharing. The 5% multiagent advantage across both models implies that distributed processing or ensemble methods provide incremental but consistent benefits. Notably, the absence of error bars or confidence intervals limits conclusions about statistical significance, but the visual trend strongly favors multiagent-o1preview as the optimal method.