## Heatmap: F1 Score Analysis: Transformer Models
### Overview
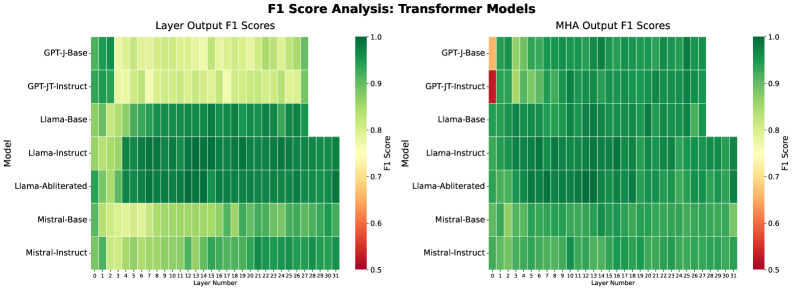
The image presents two heatmaps comparing the F1 scores of various transformer models across different layers. The left heatmap displays "Layer Output F1 Scores," while the right heatmap shows "MHA Output F1 Scores." The models compared are GPT-J-Base, GPT-JT-Instruct, Llama-Base, Llama-Instruct, Llama-Abliterated, Mistral-Base, and Mistral-Instruct. The F1 scores are represented by a color gradient, ranging from red (0.5) to green (1.0).
### Components/Axes
* **Title:** F1 Score Analysis: Transformer Models
* **Left Heatmap Title:** Layer Output F1 Scores
* **Right Heatmap Title:** MHA Output F1 Scores
* **Y-axis (Model):** GPT-J-Base, GPT-JT-Instruct, Llama-Base, Llama-Instruct, Llama-Abliterated, Mistral-Base, Mistral-Instruct
* **X-axis (Layer Number):** 0 to 31
* **Color Scale (F1 Score):** Ranges from 0.5 (red) to 1.0 (green), with intermediate values of 0.6, 0.7, 0.8, and 0.9.
### Detailed Analysis
**Left Heatmap: Layer Output F1 Scores**
* **GPT-J-Base:** Shows relatively high F1 scores (green) across all layers, with some layers showing slightly lower scores (yellowish-green).
* **GPT-JT-Instruct:** Similar to GPT-J-Base, generally high F1 scores across all layers, with some variation.
* **Llama-Base:** High F1 scores (green) up to layer 27, after which the data stops.
* **Llama-Instruct:** High F1 scores (green) up to layer 27, after which the data stops.
* **Llama-Abliterated:** Shows a mix of F1 scores, generally in the green range, but with some layers showing lower scores (yellowish-green). Data stops after layer 27.
* **Mistral-Base:** Shows a mix of F1 scores, generally in the yellowish-green range.
* **Mistral-Instruct:** Similar to Mistral-Base, with F1 scores generally in the yellowish-green range.
**Right Heatmap: MHA Output F1 Scores**
* **GPT-J-Base:** Starts with a low F1 score (orange/red) at layer 0, then quickly increases to high F1 scores (green) for the remaining layers.
* **GPT-JT-Instruct:** Starts with a very low F1 score (red) at layer 0, then quickly increases to high F1 scores (green) for the remaining layers.
* **Llama-Base:** High F1 scores (green) across all layers, data stops after layer 27.
* **Llama-Instruct:** High F1 scores (green) across all layers, data stops after layer 27.
* **Llama-Abliterated:** High F1 scores (green) across all layers, data stops after layer 27.
* **Mistral-Base:** High F1 scores (green) across all layers.
* **Mistral-Instruct:** High F1 scores (green) across all layers.
### Key Observations
* The MHA Output F1 Scores for GPT-J-Base and GPT-JT-Instruct show a significant initial drop in F1 score at layer 0 compared to the Layer Output F1 Scores.
* The Llama models (Base, Instruct, and Abliterated) have data only up to layer 27.
* The Mistral models (Base and Instruct) generally have lower Layer Output F1 Scores compared to the other models.
* The MHA Output F1 Scores are generally higher and more consistent across all models and layers (excluding the initial layer for GPT-J-Base and GPT-JT-Instruct).
### Interpretation
The heatmaps provide a visual comparison of the F1 scores of different transformer models at each layer. The Layer Output F1 Scores represent the performance of each layer individually, while the MHA Output F1 Scores represent the performance of the multi-head attention mechanism within each layer.
The initial drop in MHA Output F1 Scores for GPT-J-Base and GPT-JT-Instruct at layer 0 suggests that the multi-head attention mechanism may have some initial difficulties in processing the input at the first layer. However, this is quickly resolved in subsequent layers.
The generally higher MHA Output F1 Scores indicate that the multi-head attention mechanism is effective in improving the performance of the transformer models.
The lower Layer Output F1 Scores for the Mistral models suggest that these models may have some limitations in their individual layer performance compared to the other models.
The fact that the Llama models only have data up to layer 27 may indicate a difference in architecture or configuration compared to the other models.