## Heatmap Chart: F1 Score Analysis of Transformer Models
### Overview
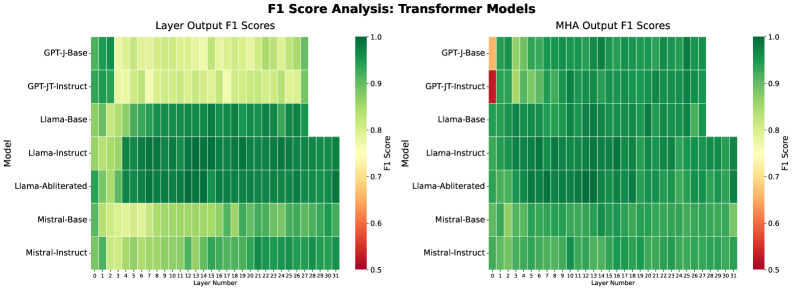
The image displays two side-by-side heatmaps comparing the F1 scores (a measure of model accuracy) across different layers of various transformer-based language models. The left heatmap analyzes "Layer Output F1 Scores," while the right analyzes "MHA (Multi-Head Attention) Output F1 Scores." The charts use a color gradient from red (low score, ~0.5) to dark green (high score, 1.0) to visualize performance.
### Components/Axes
* **Chart Titles:**
* Left Chart: "Layer Output F1 Scores"
* Right Chart: "MHA Output F1 Scores"
* **Y-Axis (Vertical):** Labeled "Model." It lists seven distinct models from top to bottom:
1. GPT-J-Base
2. GPT-JT-Instruct
3. Llama-Base
4. Llama-Instruct
5. Llama-Abliterated
6. Mistral-Base
7. Mistral-Instruct
* **X-Axis (Horizontal):** Labeled "Layer Number." It lists layers from 0 to 31 (inclusive), indicating a 32-layer model architecture.
* **Color Scale/Legend:** Located to the right of each heatmap. It is a vertical bar showing the F1 Score mapping:
* Dark Green: 1.0
* Green: ~0.9
* Light Green: ~0.8
* Yellow: ~0.7
* Orange: ~0.6
* Red: 0.5
### Detailed Analysis
**Left Heatmap: Layer Output F1 Scores**
* **GPT-J-Base:** Shows very low scores (red/orange, ~0.5-0.6) in layers 0-2. Performance improves to light green (~0.8) in middle layers and reaches dark green (~0.95-1.0) in the final layers (28-31).
* **GPT-JT-Instruct:** Similar pattern to GPT-J-Base but with a slightly better start. Early layers (0-1) are orange/red, quickly improving to yellow/light green by layer 4, and maintaining high green scores through the later layers.
* **Llama-Base:** Starts with moderate scores (yellow/light green, ~0.7-0.8) in early layers. Shows a strong, consistent performance (dark green, ~0.9-1.0) from approximately layer 6 onward.
* **Llama-Instruct:** Exhibits the strongest overall performance. Begins with good scores (green, ~0.85) and achieves near-perfect dark green scores across the vast majority of layers, especially from layer 5 onwards.
* **Llama-Abliterated:** Performance is very similar to Llama-Instruct, with high dark green scores across most layers, indicating robust performance.
* **Mistral-Base:** Starts with lower scores (yellow, ~0.7) in the first few layers. Performance steadily increases, reaching dark green in the final third of the layers (approx. layers 20-31).
* **Mistral-Instruct:** Begins with moderate scores (light green, ~0.8) and shows a clear, steady improvement trend, culminating in dark green scores in the final layers.
**Right Heatmap: MHA Output F1 Scores**
* **GPT-J-Base:** Shows a dramatic improvement. Layers 0-1 are red/orange (~0.5-0.6), but from layer 2 onward, the scores are almost uniformly dark green (~0.95-1.0).
* **GPT-JT-Instruct:** Has a notable outlier. Layer 0 is red (~0.5), but from layer 1 onward, it is almost entirely dark green.
* **Llama-Base, Llama-Instruct, Llama-Abliterated:** All three Llama variants show consistently high performance (dark green) across nearly all layers for MHA outputs, with minimal variation.
* **Mistral-Base & Mistral-Instruct:** Both show a clear gradient. They start with lighter green/yellow scores in the earliest layers (0-3) and transition to solid dark green for the remainder of the layers.
### Key Observations
1. **Layer-wise Progression:** For all models, F1 scores generally improve from earlier to later layers. The final layers (28-31) consistently show the highest performance.
2. **Model Comparison:** The "Instruct" variants (Llama-Instruct, Mistral-Instruct) and the "Abliterated" model generally outperform their "Base" counterparts, especially in the earlier and middle layers.
3. **MHA vs. Layer Output:** The MHA Output scores (right chart) are uniformly higher and reach peak performance much earlier (often by layer 2-5) compared to the general Layer Output scores. This suggests the attention mechanism's representations become highly effective very early in the network.
4. **Early Layer Vulnerability:** The first 0-3 layers are where the most significant performance deficits and variability occur, particularly for the GPT-J family of models.
5. **Outlier:** The single red cell for GPT-JT-Instruct at Layer 0 in the MHA Output chart is a stark outlier against its otherwise perfect green row.
### Interpretation
This analysis provides a granular view of how different transformer models develop their internal representations across depth. The data suggests:
* **Functional Specialization:** The stark difference between early and late layer performance indicates a functional hierarchy. Early layers likely process basic syntactic or token-level information, while later layers integrate this into semantically rich representations suitable for the final task (as measured by F1).
* **Impact of Training:** The superior performance of Instruct and Abliterated models implies that instruction-tuning or specific modification techniques lead to more robust and immediately useful internal representations across the entire network depth, not just at the output.
* **Attention is Key:** The consistently high MHA Output scores highlight the critical role of the multi-head attention mechanism. It appears to generate high-quality, task-relevant signals very early in the processing stream, which the rest of the network then refines.
* **Architectural Insight:** The uniformity of high scores in later layers across all models suggests a convergence point where the models' internal states become highly optimized for the evaluation task, regardless of their initial training differences. The early layers, however, reveal the "fingerprint" of each model's specific architecture and training regimen.