## Pie Charts: Errors in Search Only (w/o Demo) for Different Models
### Overview
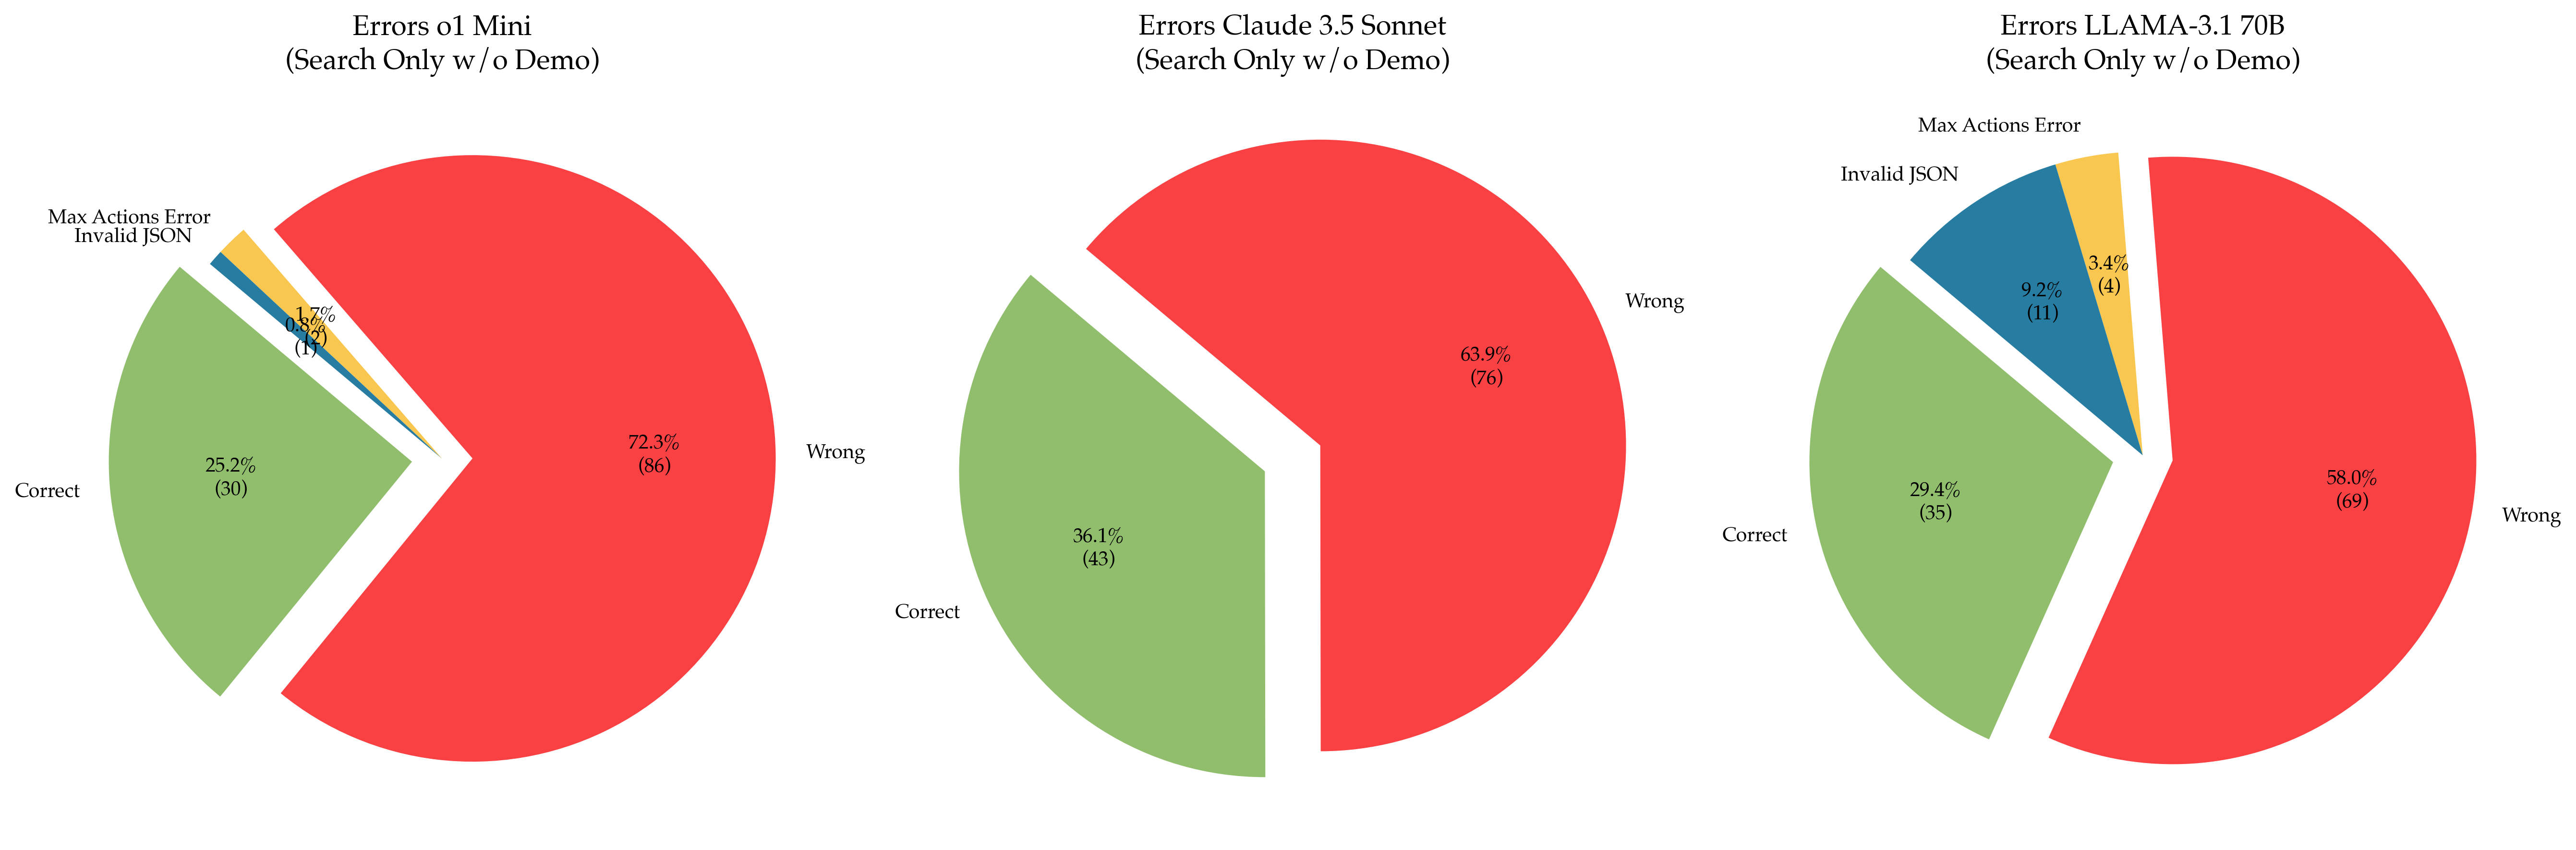
The image presents three pie charts comparing the error rates of different language models (o1 Mini, Claude 3.5 Sonnet, and LLAMA-3.1 70B) when performing search-only tasks without a demo. Each pie chart is segmented to show the percentage and count of "Correct" responses, "Wrong" responses, "Invalid JSON" errors, and "Max Actions Error".
### Components/Axes
Each pie chart represents a language model. The segments within each pie chart represent the following categories:
- **Correct**: Green segment, indicating the percentage and count of correct responses.
- **Wrong**: Red segment, indicating the percentage and count of incorrect responses.
- **Invalid JSON**: Blue segment, indicating the percentage and count of responses that resulted in invalid JSON format.
- **Max Actions Error**: Yellow segment, indicating the percentage and count of responses that resulted in exceeding the maximum number of actions.
The title of each chart specifies the model and the task:
- **Errors o1 Mini (Search Only w/o Demo)**
- **Errors Claude 3.5 Sonnet (Search Only w/o Demo)**
- **Errors LLAMA-3.1 70B (Search Only w/o Demo)**
### Detailed Analysis
**1. Errors o1 Mini (Search Only w/o Demo)**
- **Wrong**: 72.3% (86) - Red segment
- **Correct**: 25.2% (30) - Green segment
- **Invalid JSON**: 1.7% (2) - Blue segment
- **Max Actions Error**: 0.8% (1) - Yellow segment
**2. Errors Claude 3.5 Sonnet (Search Only w/o Demo)**
- **Wrong**: 63.9% (76) - Red segment
- **Correct**: 36.1% (43) - Green segment
**3. Errors LLAMA-3.1 70B (Search Only w/o Demo)**
- **Wrong**: 58.0% (69) - Red segment
- **Correct**: 29.4% (35) - Green segment
- **Invalid JSON**: 9.2% (11) - Blue segment
- **Max Actions Error**: 3.4% (4) - Yellow segment
### Key Observations
- The "o1 Mini" model has the highest percentage of "Wrong" responses (72.3%) and the lowest percentage of "Correct" responses (25.2%) among the three models.
- The "Claude 3.5 Sonnet" model has the highest percentage of "Correct" responses (36.1%) and only "Wrong" and "Correct" responses.
- The "LLAMA-3.1 70B" model has a "Wrong" response rate of 58.0% and a "Correct" response rate of 29.4%. It also exhibits "Invalid JSON" and "Max Actions Error" at 9.2% and 3.4% respectively.
### Interpretation
The pie charts provide a visual comparison of the error rates for different language models in a search-only task without a demo. The "o1 Mini" model appears to perform the worst, with a high percentage of incorrect responses. "Claude 3.5 Sonnet" performs the best, with the highest percentage of correct responses and no "Invalid JSON" or "Max Actions Error". "LLAMA-3.1 70B" falls in between, with a moderate percentage of correct responses and the presence of both "Invalid JSON" and "Max Actions Error".
The data suggests that the "Claude 3.5 Sonnet" model is the most reliable for search-only tasks without a demo among the three models tested. The presence of "Invalid JSON" and "Max Actions Error" in the "LLAMA-3.1 70B" model indicates potential issues with output formatting and action execution limits.