\n
## Heatmap: Performance Metrics for Different Datasets
### Overview
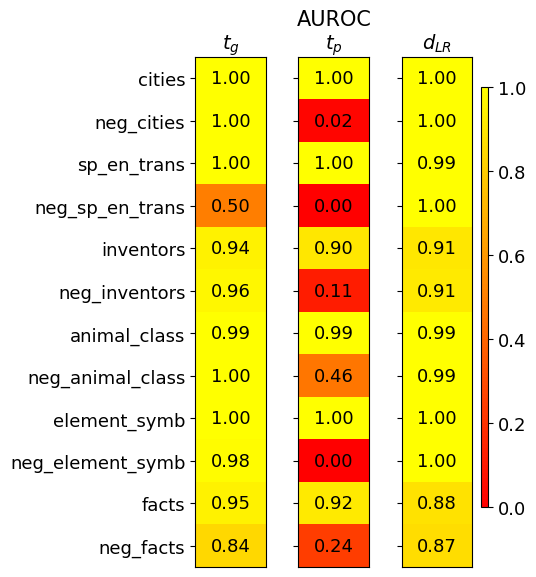
This image presents a heatmap displaying performance metrics for several datasets. The heatmap visualizes three metrics: *t<sub>G</sub>*, AUROC<sub>TP</sub>, and *d<sub>LR</sub>* across different datasets and their negative counterparts. The color intensity represents the metric value, with a scale ranging from 0.0 to 1.0.
### Components/Axes
* **Rows (Datasets):**
* cities
* neg\_cities
* sp\_en\_trans
* neg\_sp\_en\_trans
* inventors
* neg\_inventors
* animal\_class
* neg\_animal\_class
* element\_symb
* neg\_element\_symb
* facts
* neg\_facts
* **Columns (Metrics):**
* t<sub>G</sub> (top-left)
* AUROC<sub>TP</sub> (center)
* d<sub>LR</sub> (top-right)
* **Color Scale (right side):** Ranges from 0.0 (dark red) to 1.0 (dark yellow). The scale is marked at 0.0, 0.2, 0.4, 0.6, 0.8, and 1.0.
### Detailed Analysis
The heatmap displays the values for each dataset-metric combination. I will analyze each metric column separately, noting trends and specific values.
**t<sub>G</sub> Column:**
* The values in this column are generally high, mostly around 1.00.
* cities: 1.00
* neg\_cities: 1.00
* sp\_en\_trans: 1.00
* neg\_sp\_en\_trans: 0.50
* inventors: 0.94
* neg\_inventors: 0.96
* animal\_class: 0.99
* neg\_animal\_class: 1.00
* element\_symb: 1.00
* neg\_element\_symb: 0.98
* facts: 0.95
* neg\_facts: 0.84
**AUROC<sub>TP</sub> Column:**
* This column shows more variation. Several values are close to 1.00, but there are some significantly lower values.
* cities: 1.00
* neg\_cities: 0.02
* sp\_en\_trans: 1.00
* neg\_sp\_en\_trans: 0.00
* inventors: 0.90
* neg\_inventors: 0.11
* animal\_class: 0.99
* neg\_animal\_class: 0.46
* element\_symb: 1.00
* neg\_element\_symb: 0.00
* facts: 0.92
* neg\_facts: 0.24
**d<sub>LR</sub> Column:**
* Values in this column are also generally high, with most around 0.90-1.00.
* cities: 1.00
* neg\_cities: 1.00
* sp\_en\_trans: 0.99
* neg\_sp\_en\_trans: 1.00
* inventors: 0.91
* neg\_inventors: 0.91
* animal\_class: 0.99
* neg\_animal\_class: 0.99
* element\_symb: 1.00
* neg\_element\_symb: 1.00
* facts: 0.88
* neg\_facts: 0.87
### Key Observations
* The "neg\_" datasets consistently show lower AUROC<sub>TP</sub> values compared to their corresponding positive datasets. This suggests that the model performs worse on the negative examples for these datasets.
* The *t<sub>G</sub>* and *d<sub>LR</sub>* metrics are generally high across all datasets, indicating good performance in these aspects.
* The lowest AUROC<sub>TP</sub> values are observed for "neg\_cities", "neg\_sp\_en\_trans", and "neg\_element\_symb", all of which are 0.00 or 0.02.
* The "neg\_inventors" and "neg\_animal\_class" datasets also have relatively low AUROC<sub>TP</sub> values (0.11 and 0.46, respectively).
### Interpretation
This heatmap likely represents the performance of a classification model on various datasets. The three metrics provide different insights into the model's capabilities:
* *t<sub>G</sub>* likely represents a threshold-based metric, potentially related to the true positive rate at a specific threshold. High values suggest good performance in identifying positive cases.
* AUROC<sub>TP</sub> (Area Under the Receiver Operating Characteristic curve for True Positives) is a standard measure of classification performance, indicating the model's ability to distinguish between positive and negative classes. Lower values for the "neg\_" datasets suggest the model struggles to correctly identify negative examples.
* *d<sub>LR</sub>* (likely a measure of discrimination or likelihood ratio) indicates how well the model separates positive and negative classes. High values suggest good separation.
The consistent pattern of lower AUROC<sub>TP</sub> values for the "neg\_" datasets suggests that the model may be biased towards predicting positive classes or that the negative examples are more challenging to classify. This could be due to imbalanced datasets, the nature of the negative examples, or limitations in the model's ability to generalize. The high *t<sub>G</sub>* and *d<sub>LR</sub>* values indicate that when the model *does* predict a positive case, it is generally correct, but it may be overconfident in its positive predictions. Further investigation into the characteristics of the negative examples and potential bias mitigation techniques would be beneficial.