## Heatmap: Performance Metrics Across Categories
### Overview
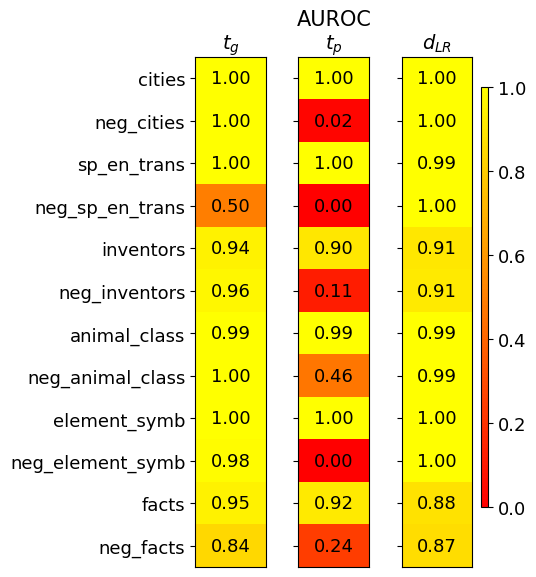
The image is a heatmap comparing three performance metrics (t_g, t_p, d_LR) across 12 categories. Values range from 0.00 to 1.00, with a color gradient from red (low) to yellow (high). The heatmap reveals patterns in how different categories perform across metrics, with notable differences in negation-affected categories.
### Components/Axes
- **X-axis (Columns)**:
- `t_g` (Ground Truth Score)
- `t_p` (Predicted Score)
- `d_LR` (Difference in Log Ratio)
- **Y-axis (Rows)**:
- Categories: cities, neg_cities, sp_en_trans, neg_sp_en_trans, inventors, neg_inventors, animal_class, neg_animal_class, element_symb, neg_element_symb, facts, neg_facts
- **Legend**:
- Color scale from red (0.0) to yellow (1.0), positioned on the right.
- **Text Embedding**:
- Numerical values in each cell (e.g., "1.00", "0.02") with two decimal places.
### Detailed Analysis
#### Categories and Values
1. **cities**:
- t_g: 1.00 (yellow), t_p: 1.00 (yellow), d_LR: 1.00 (yellow)
2. **neg_cities**:
- t_g: 1.00 (yellow), t_p: 0.02 (red), d_LR: 1.00 (yellow)
3. **sp_en_trans**:
- t_g: 1.00 (yellow), t_p: 1.00 (yellow), d_LR: 0.99 (yellow)
4. **neg_sp_en_trans**:
- t_g: 0.50 (orange), t_p: 0.00 (red), d_LR: 1.00 (yellow)
5. **inventors**:
- t_g: 0.94 (orange), t_p: 0.90 (orange), d_LR: 0.91 (orange)
6. **neg_inventors**:
- t_g: 0.96 (orange), t_p: 0.11 (red), d_LR: 0.91 (orange)
7. **animal_class**:
- t_g: 0.99 (yellow), t_p: 0.99 (yellow), d_LR: 0.99 (yellow)
8. **neg_animal_class**:
- t_g: 1.00 (yellow), t_p: 0.46 (red), d_LR: 0.99 (yellow)
9. **element_symb**:
- t_g: 1.00 (yellow), t_p: 1.00 (yellow), d_LR: 1.00 (yellow)
10. **neg_element_symb**:
- t_g: 0.98 (yellow), t_p: 0.00 (red), d_LR: 1.00 (yellow)
11. **facts**:
- t_g: 0.95 (orange), t_p: 0.92 (orange), d_LR: 0.88 (orange)
12. **neg_facts**:
- t_g: 0.84 (orange), t_p: 0.24 (red), d_LR: 0.87 (orange)
#### Color Consistency Check
- All values align with the legend:
- Red (0.00–0.20), orange (0.20–0.60), yellow (0.60–1.00).
- Example: `neg_cities` t_p (0.02) is red, `inventors` t_g (0.94) is yellow.
### Key Observations
1. **Negation Impact**:
- Categories with "neg_" prefixes show significantly lower `t_p` values (e.g., `neg_cities` t_p = 0.02, `neg_sp_en_trans` t_p = 0.00).
- `d_LR` remains high for most negated categories (e.g., `neg_cities` d_LR = 1.00), suggesting robustness in log ratio differences despite low predicted scores.
2. **High Consistency**:
- Non-negated categories (e.g., `cities`, `animal_class`) consistently score near 1.00 across all metrics.
3. **Partial Degradation**:
- `neg_inventors` and `neg_facts` show moderate `t_g` degradation (0.96 and 0.84, respectively) but retain high `d_LR` values.
### Interpretation
The heatmap demonstrates that negation-affected categories (`neg_*`) exhibit drastic drops in predicted scores (`t_p`), while ground truth scores (`t_g`) remain relatively stable. The `d_LR` metric, which measures the difference between ground truth and predicted scores, remains high even for negated categories, indicating that the model maintains strong discriminative power despite lower absolute predictions. This suggests that the model struggles with negation handling in specific domains (e.g., cities, sp_en_trans) but retains robustness in log ratio comparisons. The consistent high `d_LR` values across negated categories imply that the model’s performance degradation is not uniformly catastrophic but context-dependent.