## Diagram: APTPU Workflow Process
### Overview
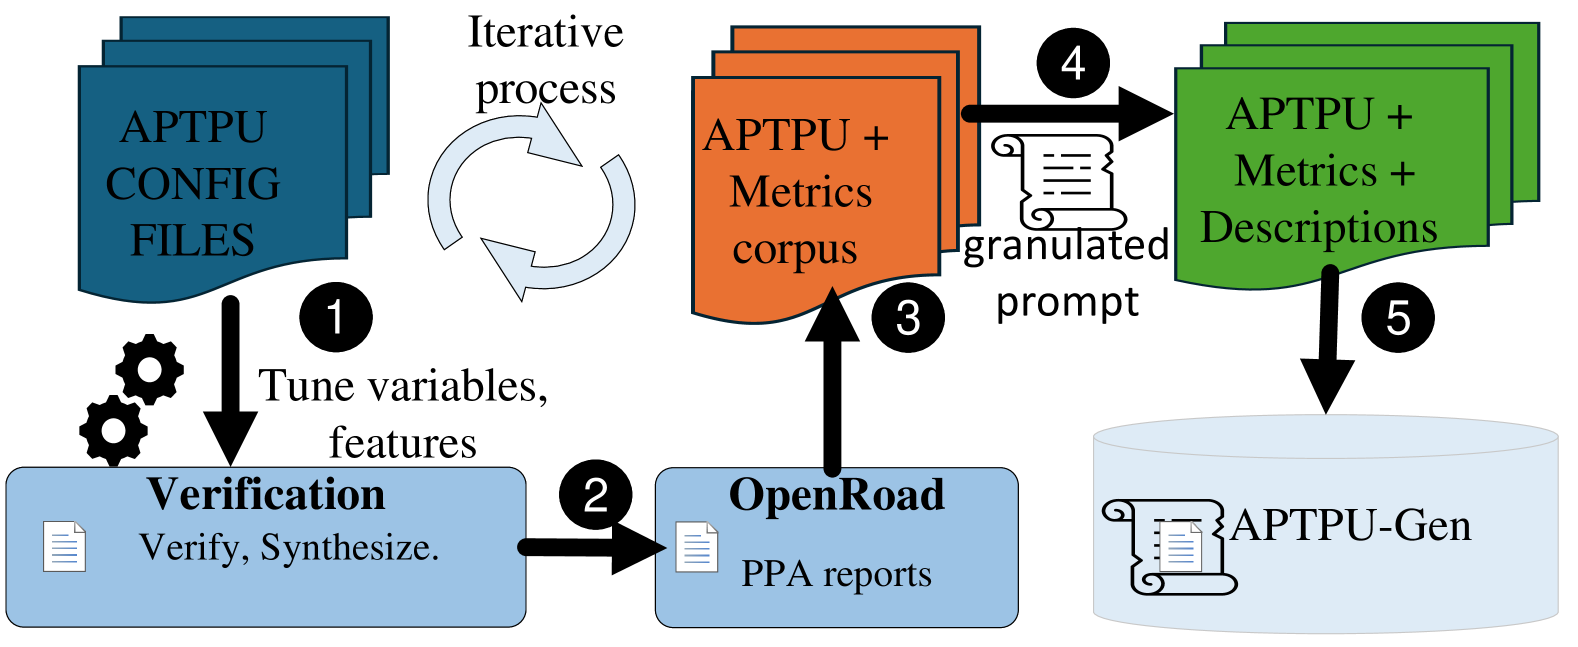
The image illustrates a five-step, iterative technical workflow designed to generate a dataset labeled "APTPU-Gen." The process begins with configuration files, moves through verification and reporting tools, incorporates a metrics corpus, and concludes with the generation of descriptive metrics.
### Components/Axes
The diagram is organized into a flow chart with distinct regions:
* **Top-Left (Blue Stack):** Labeled "APTPU CONFIG FILES."
* **Bottom-Left (Blue Box):** Labeled "Verification" with sub-text "Verify, Synthesize."
* **Bottom-Center (Blue Box):** Labeled "OpenRoad" with sub-text "PPA reports."
* **Top-Center (Orange Stack):** Labeled "APTPU + Metrics corpus."
* **Top-Right (Green Stack):** Labeled "APTPU + Metrics + Descriptions."
* **Bottom-Right (Database Icon):** Labeled "APTPU-Gen."
* **Icons/Connectors:**
* **Gears:** Located near the arrow for Step 1.
* **Circular Arrow:** Located between the Blue Stack and Orange Stack, labeled "Iterative process."
* **Scroll Icon:** Located near the arrow for Step 4, labeled "granulated prompt."
* **Numbered Circles (1-5):** Indicate the sequence of the workflow.
### Detailed Analysis
The workflow proceeds as follows:
1. **Step 1:** An arrow points downward from the **APTPU CONFIG FILES** (Blue Stack) to the **Verification** box. The text "Tune variables, features" is placed next to this arrow, accompanied by a gear icon, indicating the tuning phase.
2. **Step 2:** An arrow points to the right from the **Verification** box to the **OpenRoad** box. The **OpenRoad** box contains the text "PPA reports," indicating the output of this stage.
3. **Step 3:** An arrow points upward from the **OpenRoad** box to the **APTPU + Metrics corpus** (Orange Stack).
4. **Iterative Loop:** A circular arrow labeled "Iterative process" connects the **APTPU + Metrics corpus** back to the **APTPU CONFIG FILES**, suggesting that the metrics gathered inform future configuration tuning.
5. **Step 4:** An arrow points to the right from the **APTPU + Metrics corpus** to the **APTPU + Metrics + Descriptions** (Green Stack). This arrow passes through a scroll icon labeled "granulated prompt."
6. **Step 5:** An arrow points downward from the **APTPU + Metrics + Descriptions** (Green Stack) to the **APTPU-Gen** database icon.
### Key Observations
* **Centrality of OpenRoad:** The "OpenRoad" component acts as the primary analytical engine, converting verified configurations into PPA (Power, Performance, Area) reports.
* **Iterative Feedback:** The "Iterative process" loop indicates that the system is self-optimizing; the metrics corpus is used to refine the initial configuration files.
* **Transformation:** The transition from the Orange Stack to the Green Stack (Step 4) involves a "granulated prompt," suggesting a transformation or enrichment process (likely using a generative model) to add descriptive text to the raw metrics.
### Interpretation
This diagram represents an automated pipeline for hardware design or optimization, likely within the context of chip design (given the reference to "OpenRoad," a common open-source tool for digital layout).
* **The Logic:** The workflow demonstrates a "closed-loop" system. By generating PPA reports and aggregating them into a "Metrics corpus," the system can feed data back into the "APTPU CONFIG FILES" to improve future iterations.
* **The "Granulated Prompt":** This is the most critical transformation point. It implies that raw numerical data (metrics) is being processed through a prompt-based system (likely an LLM or similar AI) to generate human-readable or structured "Descriptions."
* **The Outcome:** The final "APTPU-Gen" database represents a refined, enriched dataset that combines raw configuration, performance metrics, and descriptive insights, making it highly valuable for training models or performing comparative analysis on hardware designs.