\n
## Diagram: APTPU Design and Generation Flow
### Overview
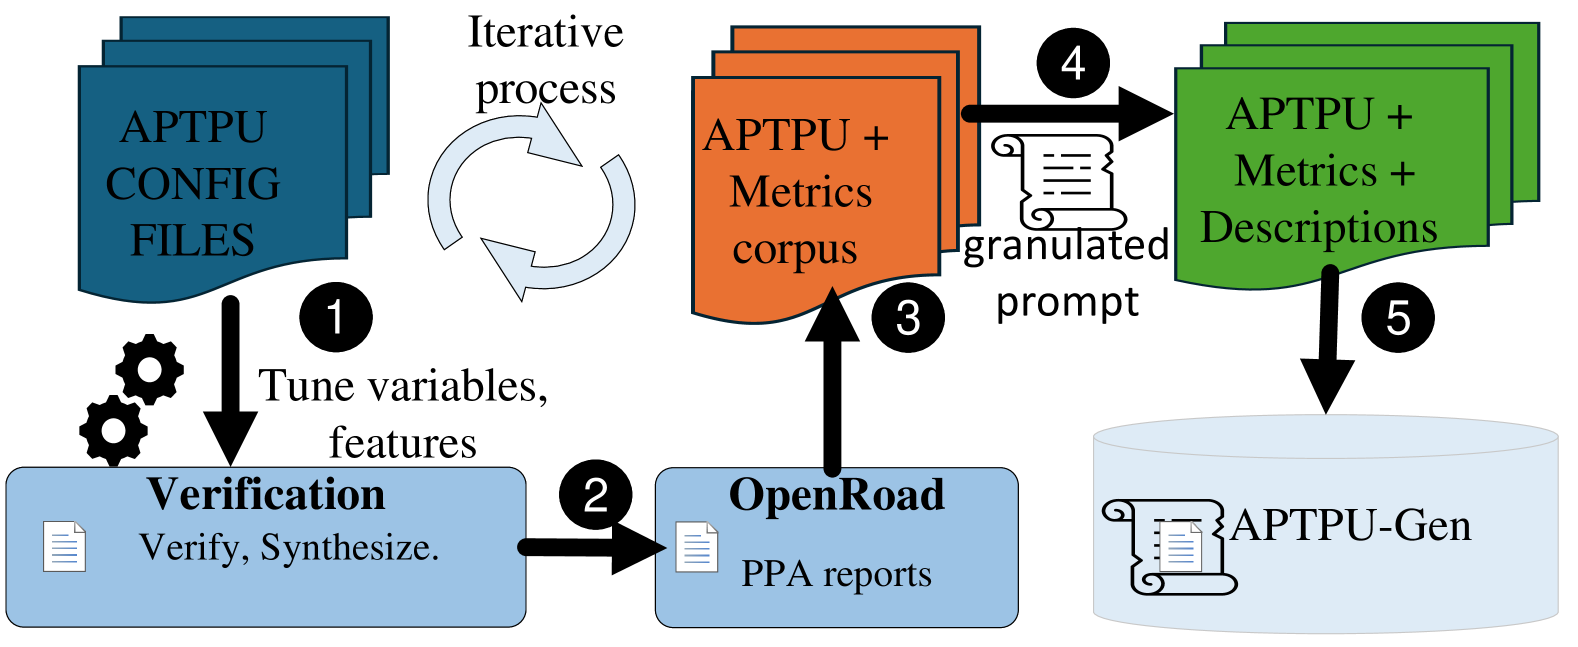
This diagram illustrates an iterative process for designing and generating APTPU (likely an acronym for a hardware or software component) configurations. The process involves configuration files, verification, OpenRoad analysis, prompt generation, and ultimately, APTPU generation. The diagram uses numbered arrows to indicate the flow of information and a circular arrow to denote the iterative nature of the process.
### Components/Axes
The diagram consists of several rectangular blocks representing data or process stages, connected by arrows. Key components include:
* **APTPU CONFIG FILES:** Stack of blue rectangles.
* **Verification:** A grey gear-shaped block with text "Verify, Synthesize."
* **OpenRoad:** A light blue rectangle with text "PPA reports".
* **APTPU + Metrics corpus:** Stack of orange rectangles.
* **APTPU + Metrics + Descriptions:** Stack of green rectangles.
* **APTPU-Gen:** A light-brown cone-shaped block.
* **Granulated prompt:** A black circle containing a document icon.
* **Iterative process:** A circular arrow.
* **Numbered Arrows:** 1 through 5, indicating the flow.
### Detailed Analysis or Content Details
The diagram depicts a five-step process:
1. **APTPU CONFIG FILES** feed into **Verification**. The arrow is labeled "Tune variables, features".
2. **Verification** outputs to **OpenRoad**.
3. **OpenRoad** outputs to **APTPU + Metrics corpus**.
4. **APTPU + Metrics corpus** feeds into **Granulated prompt**.
5. **Granulated prompt** feeds into **APTPU + Metrics + Descriptions**.
6. **APTPU + Metrics + Descriptions** feeds into **APTPU-Gen**.
The **Iterative process** arrow loops from **APTPU + Metrics corpus** back to **APTPU CONFIG FILES**, indicating a feedback loop.
The text within the **Verification** block states: "Verify, Synthesize."
The text within the **OpenRoad** block states: "PPA reports".
The text within the **APTPU-Gen** block states: "APTPU-Gen".
### Key Observations
The diagram emphasizes an iterative design process. The flow starts with configuration files, goes through verification and analysis (OpenRoad), and then uses the results to refine the configurations. The inclusion of "Metrics" and "Descriptions" suggests a focus on quantifiable performance and detailed documentation. The "Granulated prompt" suggests the use of a prompt-based system, potentially leveraging large language models or similar technologies.
### Interpretation
This diagram outlines a methodology for automated or semi-automated design space exploration and optimization of an APTPU. The iterative loop suggests a continuous improvement cycle where analysis results (PPA reports from OpenRoad) are used to refine the configuration files. The generation of "Metrics" and "Descriptions" alongside the APTPU suggests a focus on not only creating a functional component but also understanding and documenting its performance characteristics. The "Granulated prompt" component hints at the use of AI or machine learning techniques to guide the design process, potentially by generating prompts for synthesis or optimization tools. The overall process appears to be geared towards efficient and well-documented APTPU development. The diagram does not provide specific data or numerical values, but rather illustrates a workflow.