## Process Diagram: APTPU Document Generation Workflow
### Overview
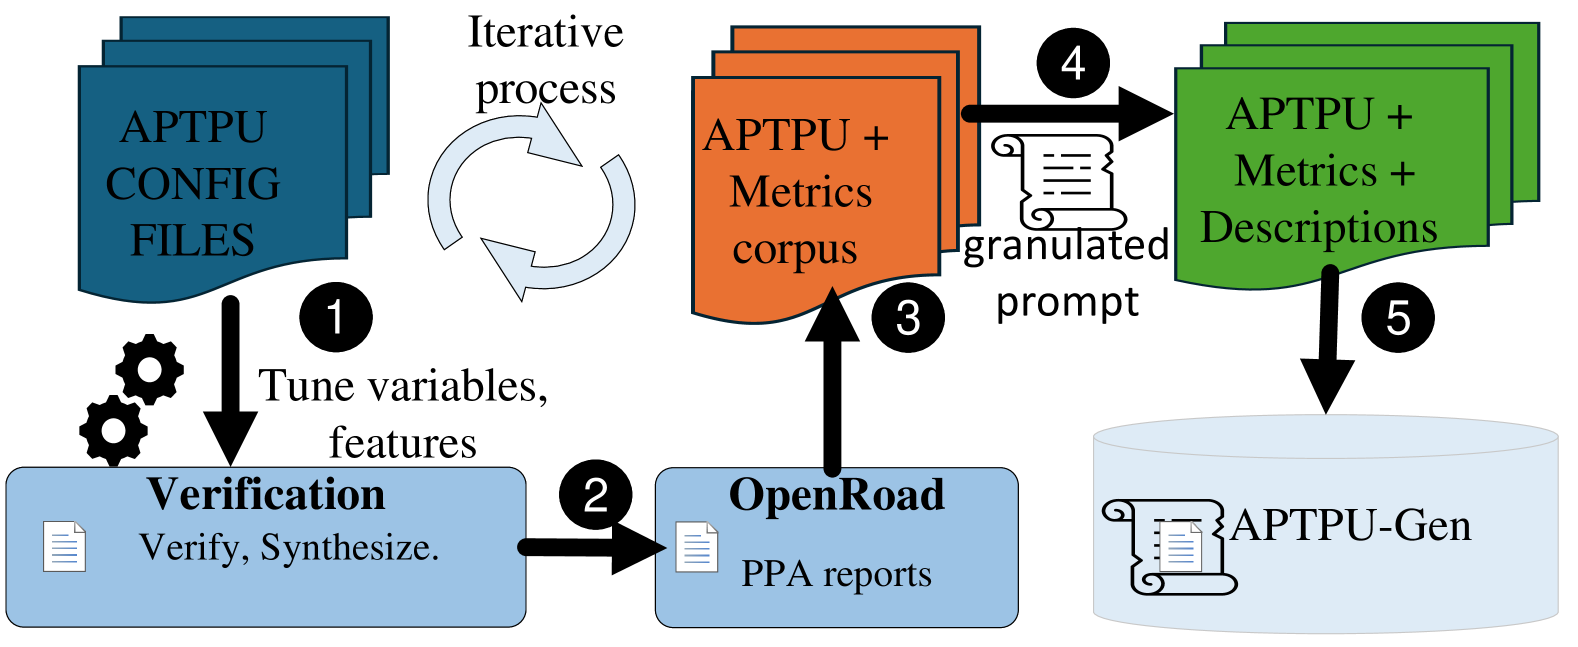
This image is a technical flowchart illustrating a five-step, iterative process for generating and refining documents related to "APTPU" (likely an acronym for a specific technical unit or project). The workflow moves from initial configuration files through verification, synthesis, data collection, and prompt engineering to produce a final generated output stored in a database. The process emphasizes iteration and the enrichment of data at each stage.
### Components/Axes
The diagram is organized into a flow from left to right, with numbered steps (1-5) indicating the sequence. Key components include:
1. **Input (Top-Left):** A stack of three blue document icons labeled **"APTPU CONFIG FILES"**.
2. **Process Block 1 (Bottom-Left):** A light blue rounded rectangle labeled **"Verification"** with the subtext **"Verify, Synthesize."**. It is accompanied by a document icon and two gear icons to its left.
3. **Process Block 2 (Bottom-Center):** A light blue rounded rectangle labeled **"OpenRoad"** with the subtext **"PPA reports"**. It is accompanied by a document icon.
4. **Data Corpus (Top-Center):** A stack of three orange document icons labeled **"APTPU + Metrics corpus"**.
5. **Prompt Element (Top-Center/Right):** A scroll icon labeled **"granulated prompt"**.
6. **Enriched Data (Top-Right):** A stack of three green document icons labeled **"APTPU + Metrics + Descriptions"**.
7. **Output (Bottom-Right):** A cylindrical database icon labeled **"APTPU-Gen"** with a scroll icon inside it.
8. **Iterative Loop (Top-Left/Center):** A circular arrow icon labeled **"Iterative process"** positioned between the initial config files and the metrics corpus.
### Detailed Analysis
The process flow is explicitly numbered:
* **Step 1:** An arrow points from the **"APTPU CONFIG FILES"** down to the **"Verification"** block. The label on this arrow reads **"Tune variables, features"**. This indicates the initial configuration is used to set parameters for verification and synthesis.
* **Step 2:** An arrow points from the **"Verification"** block to the **"OpenRoad"** block. This suggests the verified and synthesized output is passed to the OpenRoad tool (a known open-source VLSI design suite).
* **Step 3:** An arrow points upward from the **"OpenRoad"** block to the **"APTPU + Metrics corpus"**. This indicates that the PPA (Power, Performance, Area) reports generated by OpenRoad are used to build or update a corpus of data containing APTPU information and associated metrics.
* **Step 4:** An arrow points from the **"APTPU + Metrics corpus"** to the **"APTPU + Metrics + Descriptions"** stack. This arrow passes through the **"granulated prompt"** scroll icon. This step involves using a detailed prompt to enrich the existing metrics corpus with descriptive text, resulting in a more comprehensive dataset.
* **Step 5:** An arrow points downward from the **"APTPU + Metrics + Descriptions"** stack to the **"APTPU-Gen"** database. This is the final generation step, where the enriched data is used to produce and store the final output.
The **"Iterative process"** loop connects the later stages back to the beginning, implying that the generated outputs or learned metrics can be used to retune the initial configuration variables and features, starting the cycle anew for improvement.
### Key Observations
* **Data Enrichment Pipeline:** The core pattern is the progressive enrichment of data: from raw configs, to verified designs, to PPA metrics, to metrics with descriptions, and finally to a generated product.
* **Tool Integration:** The diagram explicitly names **"OpenRoad"**, indicating this workflow is integrated with or designed for the open-source silicon implementation toolchain.
* **Focus on PPA:** The mention of **"PPA reports"** strongly suggests this process is related to hardware design or chip development, where Power, Performance, and Area are critical optimization targets.
* **Prompt Engineering:** The inclusion of a **"granulated prompt"** as a distinct step highlights the use of natural language processing or generative AI techniques to transform structured data (metrics) into enriched data (metrics + descriptions).
* **Closed-Loop Iteration:** The presence of the iterative loop signifies this is not a one-pass process but a continuous refinement cycle.
### Interpretation
This diagram outlines a sophisticated, automated or semi-automated pipeline for generating technical documentation or design specifications for an "APTPU." The process leverages hardware design tools (OpenRoad) to generate quantitative data (PPA metrics) from configuration files. This structured data is then combined with descriptive text, likely generated via a large language model using a carefully crafted ("granulated") prompt, to create a rich, human-readable corpus. The final "APTPU-Gen" output could be a complete design report, a datasheet, or even generative code for the unit.
The **Peircean investigative** reading suggests this is a system for creating **representamen** (the generated documents) that accurately stand for the **object** (the actual APTPU design) based on an **interpretant** (the enriched metrics+descriptions corpus). The iterative loop is crucial, as it allows the system to self-correct and improve the fidelity of its representations over time. The outlier or notable emphasis is the central role of the "granulated prompt," positioning prompt engineering as a critical bridge between quantitative engineering data and qualitative descriptive output in this technical generation workflow.