## Flowchart: APTPU Process Workflow
### Overview
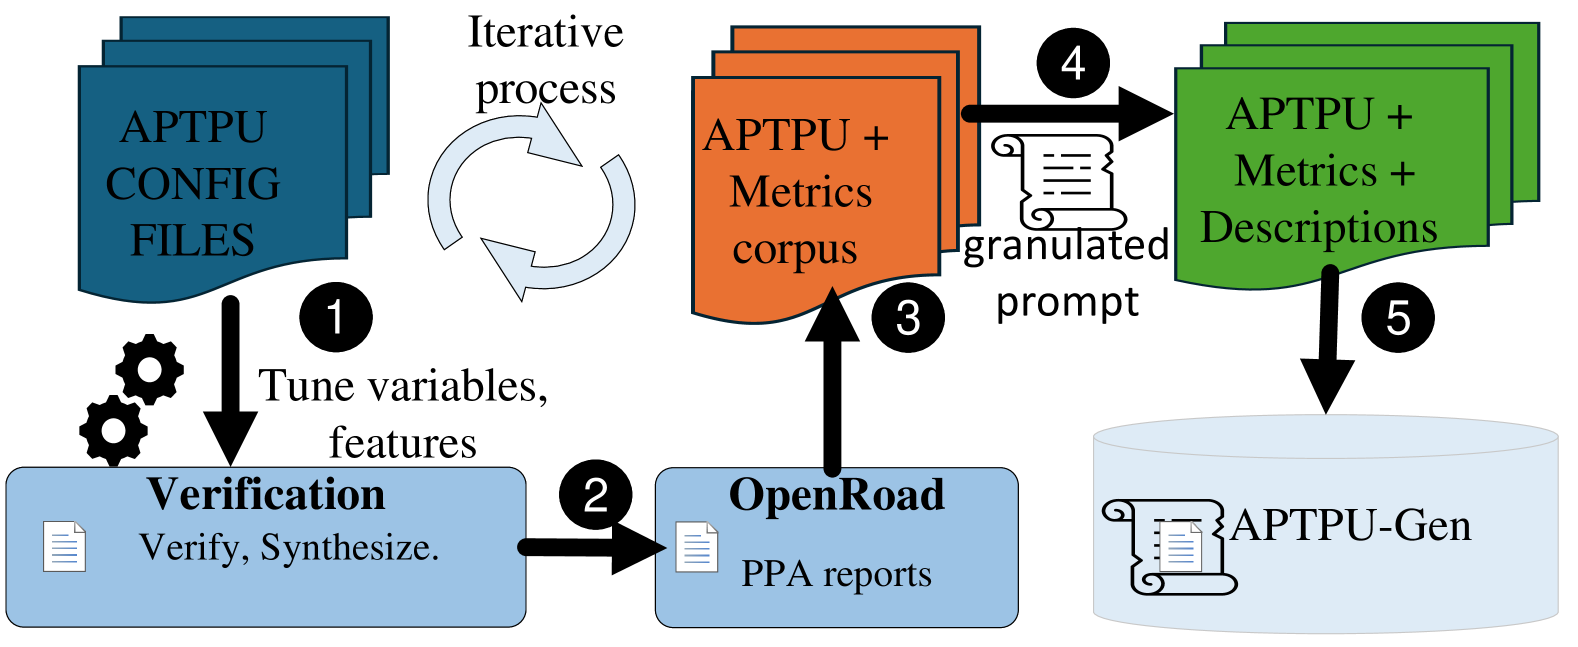
The image depicts a multi-stage iterative process for generating and refining APTPU (Automated Process for Tuning and Parameterization of Uncertainty) configurations. The workflow involves tuning variables, verification, OpenRoad PPA reports, corpus creation, and final database generation. Feedback loops indicate iterative refinement.
### Components/Axes
1. **Stages**:
- **Blue Rectangles**:
- "APTPU CONFIG FILES" (Step 1)
- "Verification" (Step 2)
- "OpenRoad" (Step 3)
- **Orange Rectangle**: "APTPU + Metrics corpus" (Step 4)
- **Green Rectangles**: "APTPU + Metrics + Descriptions" (Step 5)
- **Database**: "APTPU-Gen" (Final output)
2. **Arrows**:
- **Black Arrows**: Sequential flow (Steps 1→2→3→4→5).
- **Light Blue Arrow**: Feedback loop labeled "Iterative process" connecting Step 4 to Step 1.
3. **Icons**:
- **Gears**: Represent "Tune variables, features" in Step 1.
- **Document Icon**: Appears in verification (Step 2) and OpenRoad (Step 3).
- **Database Icon**: Final output "APTPU-Gen."
### Detailed Analysis
1. **Step 1 (Blue)**:
- **Input**: "APTPU CONFIG FILES."
- **Action**: "Tune variables, features" (gears icon).
- **Output**: Feeds into Step 2.
2. **Step 2 (Blue)**:
- **Action**: "Verification" with sub-actions "Verify, Synthesize."
- **Output**: Connects to Step 3 via black arrow.
3. **Step 3 (Blue)**:
- **Input**: "OpenRoad PPA reports."
- **Output**: Connects to Step 4 via black arrow.
4. **Step 4 (Orange)**:
- **Input**: "APTPU + Metrics corpus."
- **Action**: "granulated prompt" (document icon).
- **Output**: Connects to Step 5 and feedback loop to Step 1.
5. **Step 5 (Green)**:
- **Input**: "APTPU + Metrics + Descriptions."
- **Output**: Final database "APTPU-Gen."
### Key Observations
- **Iterative Refinement**: The feedback loop from Step 4 to Step 1 ensures continuous tuning and improvement.
- **Data Progression**: Each stage adds complexity (config files → verification → metrics → descriptions).
- **Final Output**: "APTPU-Gen" database aggregates all prior stages.
### Interpretation
This flowchart represents an engineering or computational workflow for optimizing APTPU configurations. The iterative process suggests that metrics and descriptions generated in later stages (Steps 4–5) are critical for refining initial variables and features (Step 1). The inclusion of "granulated prompt" in Step 4 implies a focus on detailed, structured input for subsequent stages. The final "APTPU-Gen" database likely serves as a centralized repository for validated configurations, metrics, and descriptions, enabling scalable deployment or further analysis. The use of distinct colors (blue for initial stages, orange/green for advanced stages) visually emphasizes the progression from raw configuration to refined, data-driven outputs.