## Stacked Bar Chart: Accuracy vs. Varying Maximum Depth
### Overview
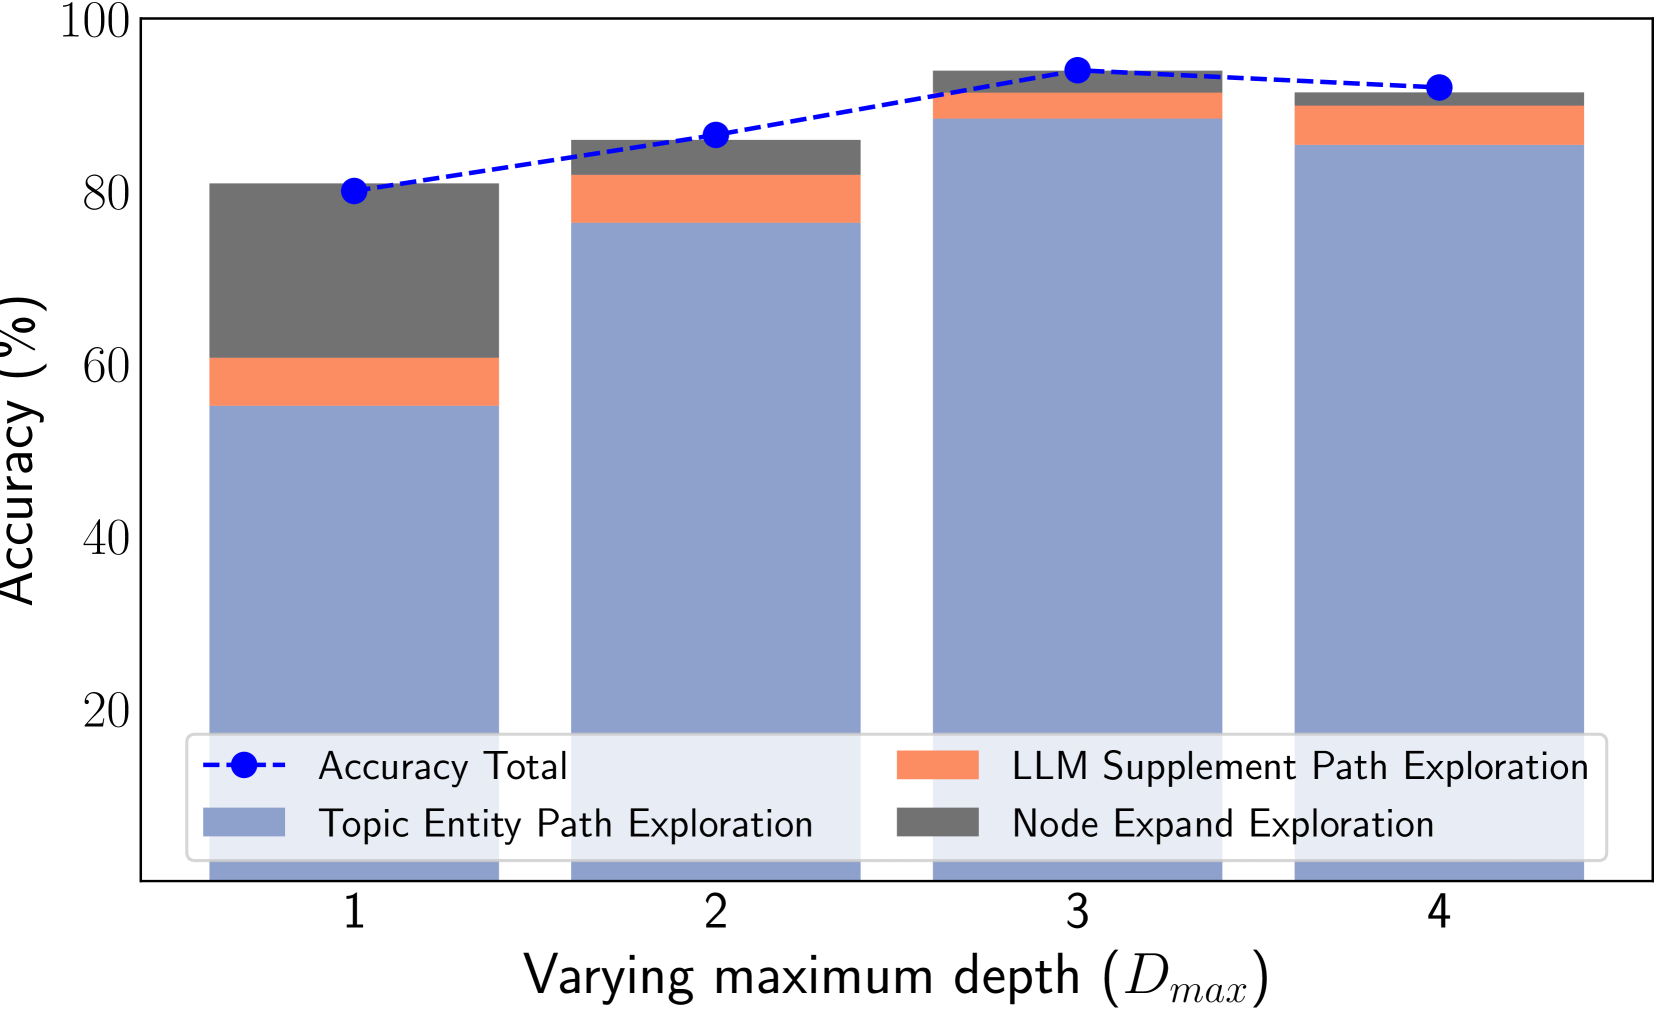
The image is a stacked bar chart showing the accuracy (%) on the y-axis versus the varying maximum depth (Dmax) on the x-axis. The chart compares the contributions of "Topic Entity Path Exploration", "LLM Supplement Path Exploration", and "Node Expand Exploration" to the overall accuracy. A dashed line represents the "Accuracy Total".
### Components/Axes
* **Y-axis:** "Accuracy (%)", ranging from 0 to 100 in increments of 20.
* **X-axis:** "Varying maximum depth (Dmax)", with values 1, 2, 3, and 4.
* **Legend:** Located at the bottom-left of the chart.
* "Accuracy Total" (blue dashed line with circular markers)
* "Topic Entity Path Exploration" (light blue bars)
* "LLM Supplement Path Exploration" (coral/orange bars)
* "Node Expand Exploration" (gray bars)
### Detailed Analysis
* **Topic Entity Path Exploration (Light Blue):**
* At Dmax = 1, the value is approximately 55%.
* At Dmax = 2, the value is approximately 75%.
* At Dmax = 3, the value is approximately 90%.
* At Dmax = 4, the value is approximately 85%.
* Trend: Generally increasing from Dmax = 1 to Dmax = 3, then slightly decreasing at Dmax = 4.
* **LLM Supplement Path Exploration (Coral/Orange):**
* At Dmax = 1, the value is approximately 5%.
* At Dmax = 2, the value is approximately 10%.
* At Dmax = 3, the value is approximately 3%.
* At Dmax = 4, the value is approximately 3%.
* Trend: Increasing from Dmax = 1 to Dmax = 2, then decreasing from Dmax = 2 to Dmax = 4.
* **Node Expand Exploration (Gray):**
* At Dmax = 1, the value is approximately 20%.
* At Dmax = 2, the value is approximately 1%.
* At Dmax = 3, the value is approximately 1%.
* At Dmax = 4, the value is approximately 3%.
* Trend: Decreasing significantly from Dmax = 1 to Dmax = 2, then relatively stable.
* **Accuracy Total (Blue Dashed Line):**
* At Dmax = 1, the value is approximately 80%.
* At Dmax = 2, the value is approximately 86%.
* At Dmax = 3, the value is approximately 93%.
* At Dmax = 4, the value is approximately 91%.
* Trend: Generally increasing from Dmax = 1 to Dmax = 3, then slightly decreasing at Dmax = 4.
### Key Observations
* "Topic Entity Path Exploration" contributes the most to the overall accuracy at higher Dmax values.
* "Node Expand Exploration" has a significant contribution at Dmax = 1, but its contribution decreases sharply as Dmax increases.
* "LLM Supplement Path Exploration" has a relatively small contribution across all Dmax values.
* The total accuracy peaks at Dmax = 3 and slightly decreases at Dmax = 4.
### Interpretation
The chart suggests that increasing the maximum depth (Dmax) initially improves the overall accuracy, primarily due to the increasing contribution of "Topic Entity Path Exploration". However, beyond a certain depth (Dmax = 3), the accuracy plateaus or even slightly decreases, indicating diminishing returns or potential overfitting. The "Node Expand Exploration" seems to be more effective at lower depths, while "LLM Supplement Path Exploration" plays a minor role throughout. The optimal depth appears to be around Dmax = 3, balancing the contributions of different exploration methods for maximum accuracy.