\n
## Stacked Area Chart: Accuracy vs. Depth
### Overview
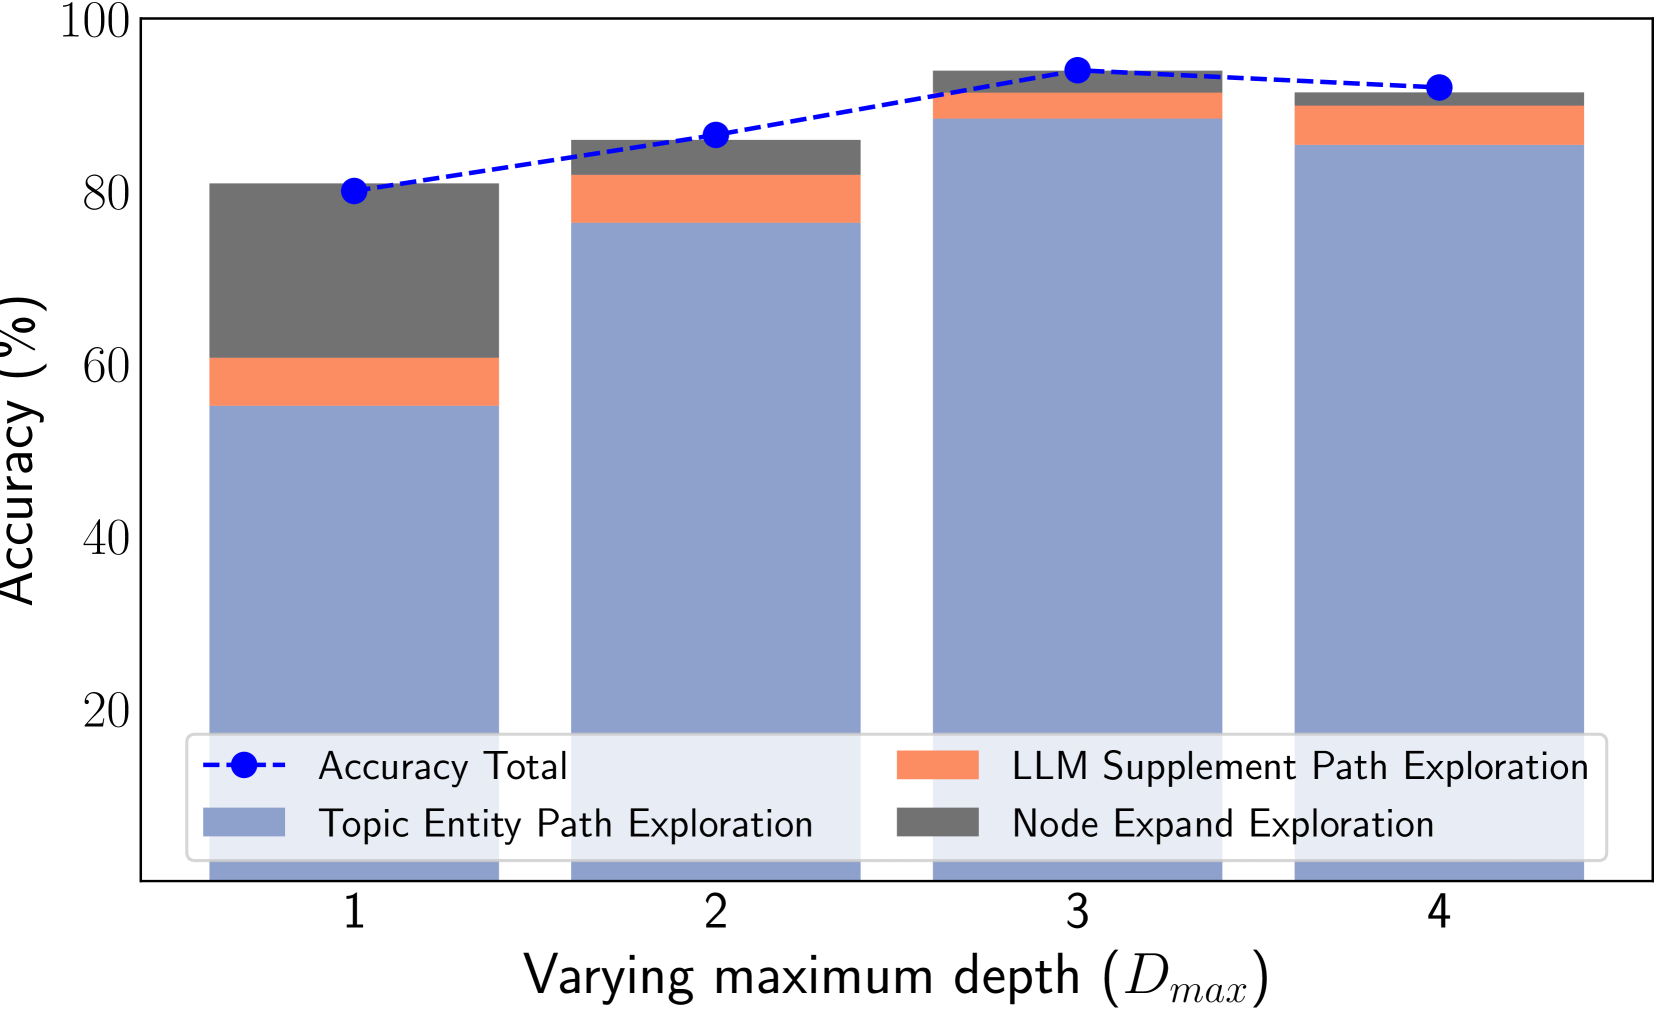
This is a stacked area chart illustrating the relationship between varying maximum depth (D<sub>max</sub>) and accuracy, broken down into different exploration methods. The chart displays the total accuracy as a line, and the contributing components as stacked areas.
### Components/Axes
* **X-axis:** Varying maximum depth (D<sub>max</sub>) with markers at 1, 2, 3, and 4.
* **Y-axis:** Accuracy (%) with a scale from 0 to 100.
* **Data Series:**
* Accuracy Total (represented by a dashed blue line with circular markers)
* Topic Entity Path Exploration (light blue area)
* Node Expand Exploration (dark gray area)
* LLM Supplement Path Exploration (orange area)
* **Legend:** Located at the bottom-right of the chart.
* Accuracy Total (blue dashed line with circles)
* Topic Entity Path Exploration (light blue)
* Node Expand Exploration (dark gray)
* LLM Supplement Path Exploration (orange)
### Detailed Analysis
The chart shows the stacked areas representing the contribution of each exploration method to the total accuracy. The total accuracy is represented by the blue dashed line.
* **D<sub>max</sub> = 1:**
* Total Accuracy: Approximately 82%.
* Topic Entity Path Exploration: Approximately 62%.
* Node Expand Exploration: Approximately 19%.
* LLM Supplement Path Exploration: Approximately 1%.
* **D<sub>max</sub> = 2:**
* Total Accuracy: Approximately 85%.
* Topic Entity Path Exploration: Approximately 66%.
* Node Expand Exploration: Approximately 18%.
* LLM Supplement Path Exploration: Approximately 1%.
* **D<sub>max</sub> = 3:**
* Total Accuracy: Approximately 90%.
* Topic Entity Path Exploration: Approximately 72%.
* Node Expand Exploration: Approximately 17%.
* LLM Supplement Path Exploration: Approximately 1%.
* **D<sub>max</sub> = 4:**
* Total Accuracy: Approximately 91%.
* Topic Entity Path Exploration: Approximately 74%.
* Node Expand Exploration: Approximately 16%.
* LLM Supplement Path Exploration: Approximately 1%.
The "Accuracy Total" line slopes upward from D<sub>max</sub> = 1 to D<sub>max</sub> = 3, then plateaus between D<sub>max</sub> = 3 and D<sub>max</sub> = 4. The "Topic Entity Path Exploration" area consistently forms the largest portion of the total accuracy, increasing slightly with increasing D<sub>max</sub>. The "Node Expand Exploration" area decreases slightly with increasing D<sub>max</sub>. The "LLM Supplement Path Exploration" area remains consistently small across all D<sub>max</sub> values.
### Key Observations
* The total accuracy increases significantly as the maximum depth (D<sub>max</sub>) increases from 1 to 3, but the improvement diminishes beyond D<sub>max</sub> = 3.
* "Topic Entity Path Exploration" is the dominant contributor to the overall accuracy.
* The contribution of "LLM Supplement Path Exploration" is minimal across all depth values.
* "Node Expand Exploration" shows a slight decrease in contribution as depth increases.
### Interpretation
The data suggests that increasing the maximum depth of exploration improves accuracy up to a certain point (D<sub>max</sub> = 3 in this case). Beyond that point, the gains in accuracy become marginal. The "Topic Entity Path Exploration" method is the most effective component of the system, indicating that leveraging topic entities and paths is crucial for achieving high accuracy. The limited impact of "LLM Supplement Path Exploration" suggests that the current implementation of LLM supplementation does not significantly enhance performance. The slight decrease in "Node Expand Exploration" contribution with increasing depth could indicate that expanding nodes becomes less relevant as the exploration focuses more on paths and entities. This chart demonstrates the importance of balancing exploration depth with the effectiveness of different exploration strategies. The plateauing of the accuracy curve suggests diminishing returns from further increasing the depth, indicating a potential optimization point for the system.