## Line Graph: Relationship Between Compute (exaFLOP) and Accuracy
### Overview
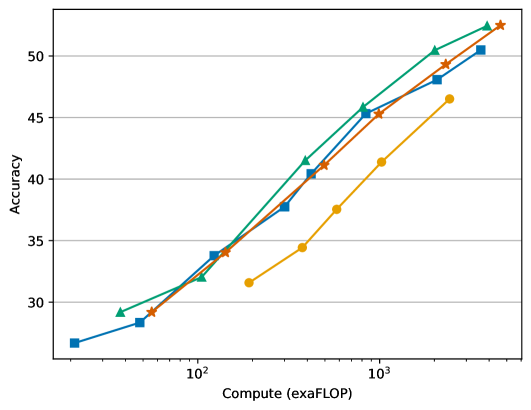
The image depicts a line graph illustrating the relationship between computational resources (measured in exaFLOP) and model accuracy. Four distinct data series are plotted, each represented by a unique color and marker. The x-axis (Compute) uses a logarithmic scale, while the y-axis (Accuracy) ranges from 25 to 55. All data series exhibit upward trends, suggesting a positive correlation between compute and accuracy.
### Components/Axes
- **X-Axis (Compute)**: Labeled "Compute (exaFLOP)" with a logarithmic scale spanning 10^2 to 10^3.
- **Y-Axis (Accuracy)**: Labeled "Accuracy" with a linear scale from 25 to 55.
- **Legend**: Located on the right side of the graph, associating colors and markers with four data series:
- Green triangles
- Orange stars
- Blue squares
- Yellow circles
### Detailed Analysis
1. **Green Triangles**:
- Starts at ~28 accuracy at 10^2 exaFLOP.
- Rises steeply to ~52 accuracy at 10^3 exaFLOP.
- **Trend**: Sharpest upward slope among all series.
2. **Orange Stars**:
- Begins at ~29 accuracy at 10^2 exaFLOP.
- Increases to ~51 accuracy at 10^3 exaFLOP.
- **Trend**: Steady but less aggressive growth compared to green.
3. **Blue Squares**:
- Starts at ~26 accuracy at 10^2 exaFLOP.
- Reaches ~50 accuracy at 10^3 exaFLOP.
- **Trend**: Consistent linear progression.
4. **Yellow Circles**:
- Begins at ~32 accuracy at 10^2 exaFLOP.
- Ends at ~46 accuracy at 10^3 exaFLOP.
- **Trend**: Slower growth, with a plateau near 10^3 exaFLOP.
### Key Observations
- All data series show a positive correlation between compute and accuracy.
- The green line (triangles) demonstrates the most efficient scaling, achieving the highest accuracy gain per exaFLOP.
- The yellow line (circles) exhibits diminishing returns, with accuracy plateauing despite increased compute.
- At 10^3 exaFLOP, the green and orange lines converge near 50–52 accuracy, while the yellow line lags at ~46.
### Interpretation
The data suggests that computational resources significantly enhance model accuracy, but the efficiency of this relationship varies across methods or models. The green line’s steep slope implies superior algorithmic or architectural optimization, maximizing accuracy per exaFLOP. In contrast, the yellow line’s slower growth may indicate inherent limitations, such as suboptimal scaling or resource bottlenecks. The convergence of green and orange lines at higher compute levels highlights potential trade-offs between resource allocation and performance gains. Notably, the yellow line’s higher starting accuracy at 10^2 exaFLOP (~32 vs. ~26–29 for others) suggests it may be pre-optimized for lower-resource environments but struggles to scale effectively.
This analysis underscores the importance of balancing computational investment with algorithmic efficiency to achieve optimal performance.