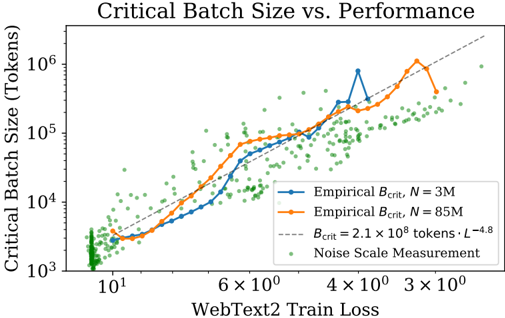
## Line Chart: Critical Batch Size vs. Performance
### Overview
The chart illustrates the relationship between WebText2 training loss (x-axis) and critical batch size in tokens (y-axis). It compares empirical critical batch sizes for two model sizes (N=3M and N=85M) against a theoretical power-law model, alongside noise scale measurements.
### Components/Axes
- **X-axis (WebText2 Train Loss)**: Logarithmic scale from 10¹ to 3×10⁰ (10 to 3).
- **Y-axis (Critical Batch Size)**: Logarithmic scale from 10³ to 10⁶ tokens.
- **Legend**:
- Blue line: Empirical B_crit for N=3M.
- Orange line: Empirical B_crit for N=85M.
- Dashed line: Theoretical B_crit = 2.1×10⁸ tokens·L⁻⁴.⁸.
- Green dots: Noise Scale Measurement.
### Detailed Analysis
1. **Empirical B_crit Lines**:
- **N=3M (Blue)**: Starts near 10³ tokens at 10¹ loss, rises sharply to ~10⁵ tokens at 3×10⁰ loss. A notable peak (~10⁵ tokens) occurs at ~4×10⁰ loss.
- **N=85M (Orange)**: Begins higher (~10⁴ tokens at 10¹ loss) and follows a steeper upward trend, reaching ~10⁶ tokens at 3×10⁰ loss.
2. **Theoretical Model (Dashed Line)**:
- Follows a power-law decay (B_crit ∝ L⁻⁴.⁸). Empirical lines closely align with this trend, validating the theoretical relationship.
3. **Noise Scale Measurements (Green Dots)**:
- Scattered across the plot, predominantly below the empirical lines. Concentrations near 10³–10⁴ tokens at lower loss values (~10¹–6×10⁰).
### Key Observations
- **Trend Verification**:
- Both empirical lines slope upward as loss decreases, confirming that lower training loss correlates with larger critical batch sizes.
- N=85M consistently requires larger batch sizes than N=3M, with a ~10× difference at 3×10⁰ loss.
- **Outliers/Anomalies**:
- The blue line’s peak at ~4×10⁰ loss (~10⁵ tokens) deviates from the general trend, suggesting potential instability or measurement noise.
- **Noise Distribution**:
- Green dots cluster at lower batch sizes, indicating variability in smaller-scale experiments.
### Interpretation
- **Model Scaling**: The data demonstrates that larger models (N=85M) demand significantly larger batch sizes to maintain performance, aligning with the power-law relationship. This implies diminishing returns in batch size efficiency as model complexity increases.
- **Theoretical Validation**: The empirical lines’ adherence to the dashed theoretical curve (B_crit = 2.1×10⁸ tokens·L⁻⁴.⁸) confirms the validity of the power-law model for predicting critical batch sizes.
- **Practical Implications**: The noise measurements highlight the need for robust experimental design, as smaller batch sizes (green dots) may represent edge cases or suboptimal configurations.
- **Anomaly Investigation**: The blue line’s peak warrants further scrutiny—it could reflect a transient instability or an outlier in the dataset.
This analysis underscores the importance of batch size scaling in training large language models and validates the theoretical framework for optimizing training efficiency.