# Technical Document Extraction: Control Value Analysis Chart
## Chart Title
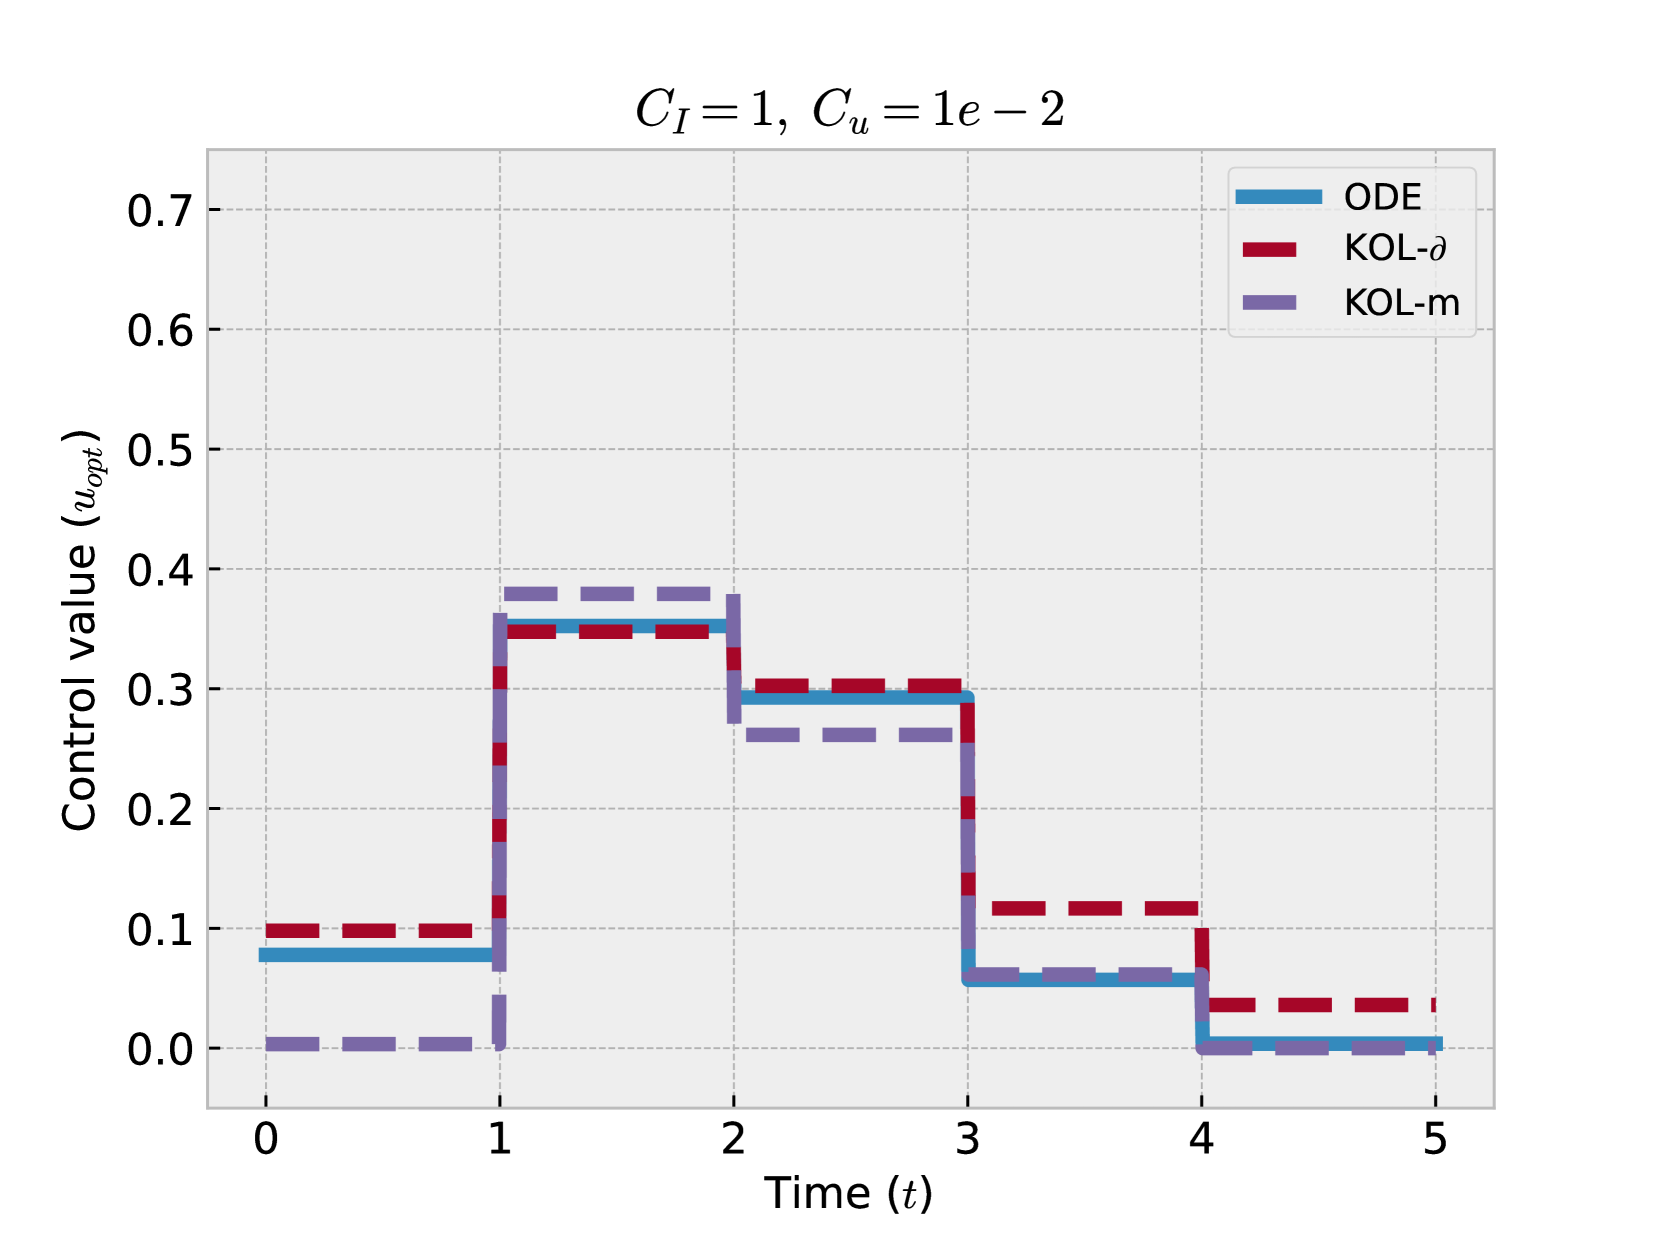
- **Title**: `C_I = 1, C_u = 1e-2`
## Axes
- **X-axis (Horizontal)**:
- Label: `Time (t)`
- Scale: Linear, 0 to 5
- Tick Marks: 0, 1, 2, 3, 4, 5
- **Y-axis (Vertical)**:
- Label: `Control value (u_opt)`
- Scale: Linear, 0.0 to 0.7
- Tick Marks: 0.0, 0.1, 0.2, 0.3, 0.4, 0.5, 0.6, 0.7
## Legend
- **Color-Coded Strategies**:
- **Blue**: ODE
- **Red**: KOL-δ
- **Purple**: KOL-m
## Data Trends
1. **ODE (Blue Line)**:
- Initial value: ~0.08 (t=0)
- Step 1: Jumps to ~0.35 at t=1
- Step 2: Drops to ~0.3 at t=2
- Step 3: Drops to ~0.08 at t=3
- Final value: ~0.08 (t=4–5)
2. **KOL-δ (Red Line)**:
- Initial value: ~0.1 (t=0)
- Step 1: Jumps to ~0.35 at t=1
- Step 2: Drops to ~0.3 at t=2
- Step 3: Drops to ~0.1 at t=3
- Final value: ~0.1 (t=4–5)
3. **KOL-m (Purple Line)**:
- Initial value: ~0.0 (t=0)
- Step 1: Jumps to ~0.35 at t=1
- Step 2: Drops to ~0.28 at t=2
- Step 3: Drops to ~0.08 at t=3
- Final value: ~0.08 (t=4–5)
## Key Observations
- All strategies exhibit stepwise control value changes at discrete time intervals (t=1, 2, 3).
- ODE and KOL-δ maintain higher control values than KOL-m after t=3.
- KOL-m shows the most significant drop at t=3 (~0.28 → ~0.08).
- ODE and KOL-δ share identical control values at t=1 and t=2 (~0.35 and ~0.3, respectively).
## Embedded Text
- No additional text blocks or annotations present in the chart.