## Line Chart: Estimator Performance Comparison
### Overview
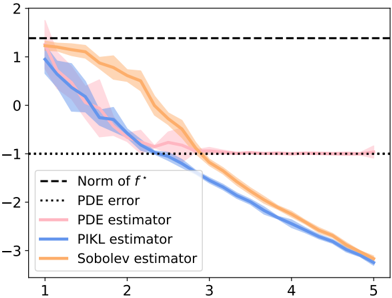
The image is a line chart comparing the performance of different estimators (PDE, PIKL, and Sobolev) against the norm of f* and the PDE error. The x-axis represents an unspecified parameter, ranging from 1 to 5. The y-axis represents the estimator values, ranging from -3 to 2. The chart includes shaded regions around the estimator lines, likely representing confidence intervals or standard deviations.
### Components/Axes
* **X-axis:** Ranges from 1 to 5, incrementing by 1. No explicit label is provided.
* **Y-axis:** Ranges from -3 to 2, incrementing by 1. No explicit label is provided.
* **Legend (bottom-left):**
* Black dashed line: "Norm of f*"
* Black dotted line: "PDE error"
* Light pink line: "PDE estimator"
* Blue line: "PIKL estimator"
* Orange line: "Sobolev estimator"
### Detailed Analysis
* **Norm of f* (Black dashed line):** A horizontal line at approximately y = 1.3.
* **PDE error (Black dotted line):** A horizontal line at approximately y = -0.9.
* **PDE estimator (Light pink line):**
* Starts at approximately (1, 1).
* Decreases to approximately (3, -1).
* Remains relatively stable around -1 after x=3.
* Has a shaded region around the line, indicating variability.
* **PIKL estimator (Blue line):**
* Starts at approximately (1, 0.8).
* Decreases steadily to approximately (5, -3).
* Has a shaded region around the line, indicating variability.
* **Sobolev estimator (Orange line):**
* Starts at approximately (1, 1.2).
* Decreases steadily to approximately (5, -3).
* Has a shaded region around the line, indicating variability.
### Key Observations
* The "Norm of f*" serves as a benchmark, remaining constant across the x-axis.
* The "PDE error" also remains constant, indicating a baseline error level.
* The PIKL and Sobolev estimators show a similar downward trend, suggesting comparable performance as x increases.
* The PDE estimator initially performs well but plateaus around the PDE error level.
### Interpretation
The chart illustrates the performance of three different estimators in relation to a target norm and a baseline error. The PIKL and Sobolev estimators converge towards lower values as the x-axis parameter increases, potentially indicating improved accuracy or stability. The PDE estimator, while initially close to the target norm, plateaus at the PDE error level, suggesting a limitation in its ability to reduce error beyond a certain point. The shaded regions around the estimator lines indicate the variability or uncertainty associated with each estimator's performance. The data suggests that for higher values of the x-axis parameter, PIKL and Sobolev estimators may be preferable to the PDE estimator.