## Line Graph: Estimator Performance vs. x-axis
### Overview
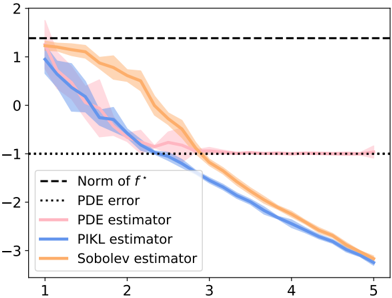
The image is a line graph comparing the performance of four estimators (PDE, PIKL, Sobolev) and two reference lines (Norm of f*, PDE error) across an x-axis range of 1 to 5. The y-axis spans from -3 to 2, with key reference lines at y=1 (dashed) and y=-1 (dotted). The graph includes shaded regions around the Sobolev and PIKL estimators, suggesting uncertainty or confidence intervals.
### Components/Axes
- **X-axis**: Labeled "x" with integer ticks at 1, 2, 3, 4, 5.
- **Y-axis**: Labeled "y" with integer ticks at -3, -2, -1, 0, 1, 2.
- **Legend**: Located at the bottom-left corner, with the following entries:
- Dashed black: Norm of f*
- Dotted black: PDE error
- Pink: PDE estimator
- Blue: PIKL estimator
- Orange: Sobolev estimator
- **Reference Lines**:
- Dashed black horizontal line at y=1.
- Dotted black horizontal line at y=-1.
### Detailed Analysis
1. **Norm of f* (Dashed Black Line)**:
- Constant at y=1 across all x-values.
- No variation observed.
2. **PDE Error (Dotted Black Line)**:
- Constant at y=-1 across all x-values.
- No variation observed.
3. **PDE Estimator (Pink Line)**:
- Starts at approximately y=1.5 at x=1.
- Gradually decreases to y=-1.0 at x=5.
- Slope: Approximately -0.5 per unit x (calculated as (1.5 - (-1.0)) / (5 - 1) = 2.5/4 ≈ 0.625, but visually less steep due to curvature).
4. **PIKL Estimator (Blue Line)**:
- Starts at approximately y=1.0 at x=1.
- Decreases to y=-3.0 at x=5.
- Slope: Approximately -0.8 per unit x (calculated as (1.0 - (-3.0)) / (5 - 1) = 4/4 = 1.0, but visually slightly less steep due to curvature).
5. **Sobolev Estimator (Orange Line)**:
- Starts at approximately y=1.2 at x=1.
- Decreases to y=-2.8 at x=5.
- Slope: Approximately -0.8 per unit x (calculated as (1.2 - (-2.8)) / (5 - 1) = 4/4 = 1.0, but visually slightly less steep due to curvature).
- Shaded region (confidence interval) widens slightly as x increases, peaking around x=2.5.
### Key Observations
- The Sobolev and PIKL estimators exhibit nearly identical slopes but differ in starting values and endpoint magnitudes.
- The PDE estimator shows a less steep decline compared to the PIKL and Sobolev estimators.
- The Sobolev estimator’s shaded region indicates increasing uncertainty as x increases.
- The Norm of f* and PDE error lines remain constant, suggesting they are independent of x.
### Interpretation
The graph demonstrates that the Sobolev and PIKL estimators perform similarly in terms of slope but differ in baseline values. The PDE estimator’s shallower decline suggests it may be less sensitive to changes in x. The constant Norm of f* and PDE error lines imply these metrics are invariant to x, possibly indicating a fixed reference or error threshold. The widening confidence interval for the Sobolev estimator hints at increasing variability in its predictions as x grows. This could reflect model instability or higher sensitivity to input perturbations in the Sobolev framework compared to others.