## Bar Chart: Accuracy Comparison Across Methods and Datasets
### Overview
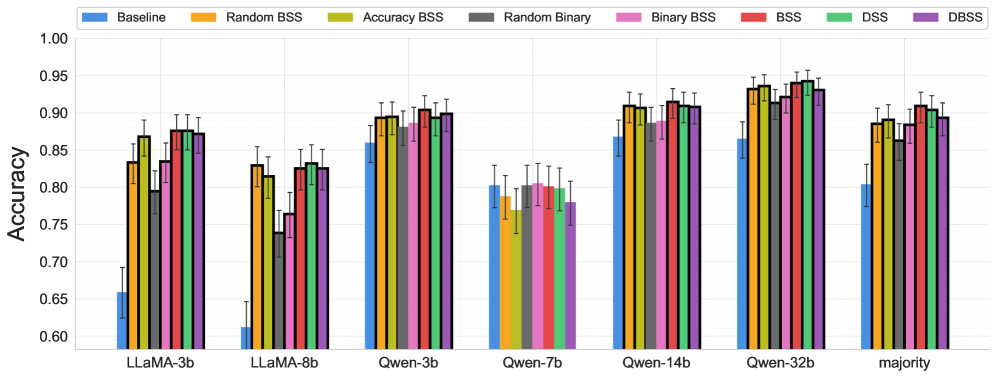
The chart compares the accuracy of various methods (Baseline, Random BSS, Accuracy BSS, Random Binary, Binary BSS, BSS, DSS, DBSS) across seven datasets (LLaMA-3b, LLaMA-8b, Qwen-3b, Qwen-7b, Qwen-14b, Qwen-32b, majority). Accuracy values range from 0.60 to 1.00, with error bars indicating variability.
### Components/Axes
- **X-axis**: Datasets (LLaMA-3b, LLaMA-8b, Qwen-3b, Qwen-7b, Qwen-14b, Qwen-32b, majority)
- **Y-axis**: Accuracy (0.60–1.00)
- **Legend**: Located in the top-right corner, mapping colors to methods:
- Blue: Baseline
- Orange: Random BSS
- Green: Accuracy BSS
- Gray: Random Binary
- Pink: Binary BSS
- Red: BSS
- Teal: DSS
- Purple: DBSS
### Detailed Analysis
1. **LLaMA-3b**:
- Baseline: ~0.65 (±0.03)
- Random BSS: ~0.84 (±0.02)
- Accuracy BSS: ~0.87 (±0.02)
- Random Binary: ~0.79 (±0.03)
- Binary BSS: ~0.83 (±0.02)
- BSS: ~0.88 (±0.02)
- DSS: ~0.87 (±0.02)
- DBSS: ~0.87 (±0.02)
2. **LLaMA-8b**:
- Baseline: ~0.62 (±0.04)
- Random BSS: ~0.83 (±0.03)
- Accuracy BSS: ~0.82 (±0.03)
- Random Binary: ~0.75 (±0.04)
- Binary BSS: ~0.77 (±0.03)
- BSS: ~0.84 (±0.03)
- DSS: ~0.83 (±0.03)
- DBSS: ~0.83 (±0.03)
3. **Qwen-3b**:
- Baseline: ~0.86 (±0.02)
- Random BSS: ~0.90 (±0.02)
- Accuracy BSS: ~0.90 (±0.02)
- Random Binary: ~0.88 (±0.03)
- Binary BSS: ~0.89 (±0.02)
- BSS: ~0.91 (±0.02)
- DSS: ~0.90 (±0.02)
- DBSS: ~0.90 (±0.02)
4. **Qwen-7b**:
- Baseline: ~0.80 (±0.03)
- Random BSS: ~0.79 (±0.03)
- Accuracy BSS: ~0.78 (±0.03)
- Random Binary: ~0.81 (±0.03)
- Binary BSS: ~0.80 (±0.03)
- BSS: ~0.82 (±0.03)
- DSS: ~0.81 (±0.03)
- DBSS: ~0.79 (±0.03)
5. **Qwen-14b**:
- Baseline: ~0.87 (±0.02)
- Random BSS: ~0.91 (±0.02)
- Accuracy BSS: ~0.91 (±0.02)
- Random Binary: ~0.89 (±0.02)
- Binary BSS: ~0.90 (±0.02)
- BSS: ~0.92 (±0.02)
- DSS: ~0.91 (±0.02)
- DBSS: ~0.91 (±0.02)
6. **Qwen-32b**:
- Baseline: ~0.87 (±0.02)
- Random BSS: ~0.93 (±0.02)
- Accuracy BSS: ~0.93 (±0.02)
- Random Binary: ~0.90 (±0.02)
- Binary BSS: ~0.92 (±0.02)
- BSS: ~0.94 (±0.02)
- DSS: ~0.93 (±0.02)
- DBSS: ~0.93 (±0.02)
7. **Majority**:
- Baseline: ~0.80 (±0.03)
- Random BSS: ~0.89 (±0.02)
- Accuracy BSS: ~0.89 (±0.02)
- Random Binary: ~0.86 (±0.03)
- Binary BSS: ~0.88 (±0.02)
- BSS: ~0.91 (±0.02)
- DSS: ~0.90 (±0.02)
- DBSS: ~0.90 (±0.02)
### Key Observations
- **Baseline Method**: Consistently the lowest accuracy across all datasets (0.62–0.87).
- **Accuracy A BSS and BSS**: Outperform other methods in most datasets, with BSS achieving the highest accuracy in Qwen-32b (~0.94).
- **Majority Dataset**: Highest accuracy for all methods (0.80–0.91), suggesting easier generalization.
- **Qwen-7b Dip**: All methods underperform compared to other Qwen datasets, with DBSS dropping to ~0.79.
- **Error Bars**: Larger variability in smaller datasets (e.g., LLaMA-8b Baseline: ±0.04).
### Interpretation
The chart demonstrates that BSS-based methods (Accuracy BSS, BSS, DSS, DBSS) significantly improve accuracy over Baseline and Random variants. The "majority" dataset acts as a performance ceiling, while Qwen-7b exhibits anomalous results, potentially due to dataset-specific challenges. The consistent superiority of BSS variants suggests their effectiveness in enhancing model accuracy, though the Qwen-7b outlier warrants further investigation into dataset-method interactions.