## Bar Chart: Test Accuracy Comparison of Activation Functions
### Overview
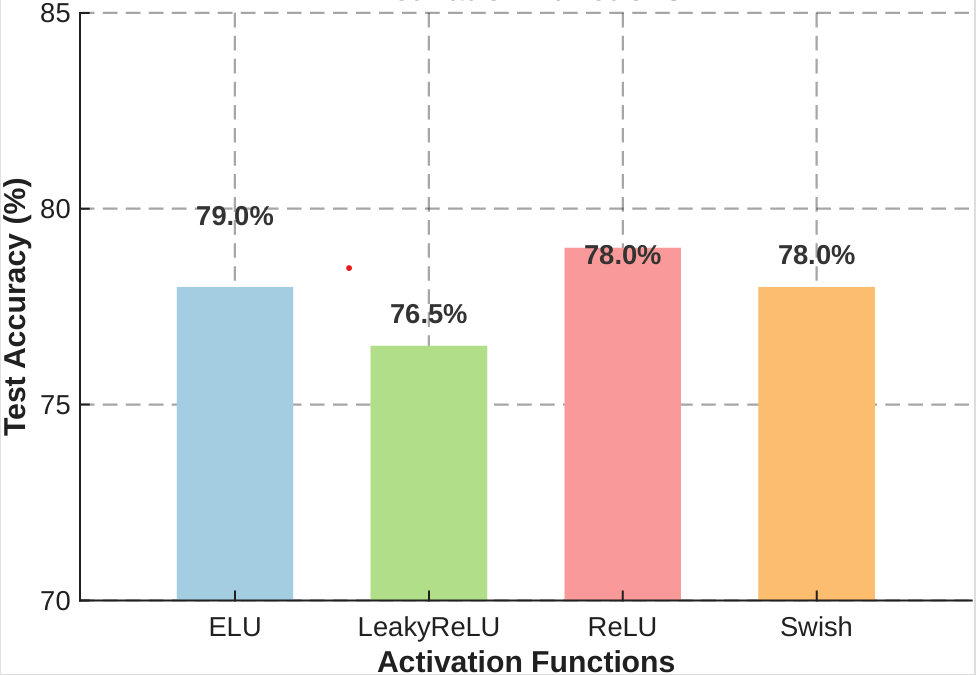
The chart compares the test accuracy (%) of four activation functions: ELU, LeakyReLU, ReLU, and Swish. Each bar represents the percentage accuracy, with values labeled on top of the bars. A red dot is positioned above the LeakyReLU bar, indicating an additional data point or anomaly.
### Components/Axes
- **X-axis**: Labeled "Activation Functions," listing four categories: ELU, LeakyReLU, ReLU, and Swish.
- **Y-axis**: Labeled "Test Accuracy (%)" with a scale from 70 to 85, marked at intervals of 5%.
- **Bars**: Four vertical bars, each colored distinctly:
- ELU: Blue (79.0%)
- LeakyReLU: Green (76.5%)
- ReLU: Red (78.0%)
- Swish: Orange (78.0%)
- **Red Dot**: Positioned above the LeakyReLU bar at 77.5%, conflicting with the bar's labeled value of 76.5%.
### Detailed Analysis
- **ELU**: Highest accuracy at 79.0%, represented by a blue bar.
- **LeakyReLU**: Lowest accuracy at 76.5%, shown as a green bar. A red dot at 77.5% is plotted above it, creating ambiguity.
- **ReLU**: Accuracy of 78.0%, depicted in red.
- **Swish**: Matches ReLU at 78.0%, shown in orange.
- **Y-axis Scale**: Ranges from 70% to 85%, with gridlines at 70, 75, 80, and 85.
### Key Observations
1. **ELU outperforms all other activation functions** by 2.5% compared to LeakyReLU and 1.0% compared to ReLU/Swish.
2. **LeakyReLU underperforms** relative to others, with a 2.5% gap from ELU and a 1.5% gap from ReLU/Swish.
3. **Red Dot Discrepancy**: The red dot at 77.5% for LeakyReLU conflicts with the bar's labeled value of 76.5%. This could indicate:
- A data entry error.
- A secondary metric (e.g., validation accuracy) not explicitly labeled.
- A visualization artifact (e.g., misplaced marker).
### Interpretation
The chart suggests that **ELU is the most effective activation function** for the tested model, while **LeakyReLU lags behind**. The near-identical performance of ReLU and Swish implies they are functionally equivalent in this context. The red dot above LeakyReLU introduces uncertainty, as its value (77.5%) does not align with the bar's label (76.5%). This inconsistency warrants further investigation to determine whether it represents a separate data point, a labeling error, or a visualization mistake. The chart emphasizes the importance of activation function selection in optimizing model performance, with ELU emerging as the clear leader.