## Line Chart: Hits@10 Values vs. Training Epochs
### Overview
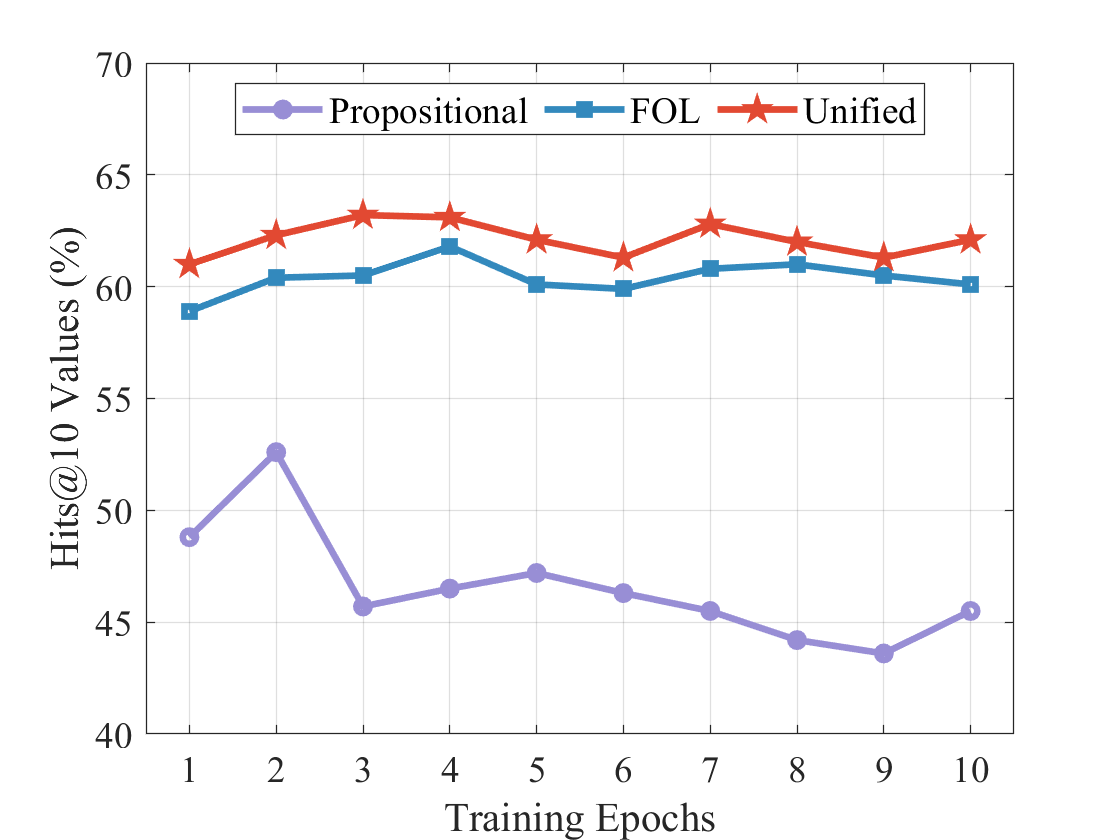
The image is a line chart comparing the performance of three different models (Propositional, FOL, and Unified) over 10 training epochs. The y-axis represents "Hits@10 Values (%)", and the x-axis represents "Training Epochs". The chart shows how the performance of each model changes as the training progresses.
### Components/Axes
* **X-axis:** Training Epochs, labeled from 1 to 10.
* **Y-axis:** Hits@10 Values (%), labeled from 40 to 70 with increments of 5.
* **Legend:** Located at the top of the chart, it identifies each line:
* Propositional (purple line with circle markers)
* FOL (blue line with square markers)
* Unified (red line with star markers)
### Detailed Analysis
* **Propositional (Purple):**
* Epoch 1: Approximately 49%
* Epoch 2: Peaks at approximately 53%
* Epoch 3: Drops to approximately 46%
* Epoch 4: Approximately 47%
* Epoch 5: Approximately 47%
* Epoch 6: Approximately 46%
* Epoch 7: Approximately 45.5%
* Epoch 8: Approximately 44%
* Epoch 9: Approximately 43.5%
* Epoch 10: Approximately 45.5%
* Trend: Starts at 49%, peaks at epoch 2, then generally declines until epoch 9, with a slight increase at epoch 10.
* **FOL (Blue):**
* Epoch 1: Approximately 59%
* Epoch 2: Approximately 60.5%
* Epoch 3: Approximately 60.5%
* Epoch 4: Approximately 62%
* Epoch 5: Approximately 60%
* Epoch 6: Approximately 60%
* Epoch 7: Approximately 61%
* Epoch 8: Approximately 61%
* Epoch 9: Approximately 60.5%
* Epoch 10: Approximately 60%
* Trend: Relatively stable performance, hovering around 60-62% throughout the training epochs.
* **Unified (Red):**
* Epoch 1: Approximately 61%
* Epoch 2: Approximately 62.5%
* Epoch 3: Approximately 63%
* Epoch 4: Approximately 63%
* Epoch 5: Approximately 62%
* Epoch 6: Approximately 61%
* Epoch 7: Approximately 63%
* Epoch 8: Approximately 62%
* Epoch 9: Approximately 61%
* Epoch 10: Approximately 62%
* Trend: Starts at 61%, peaks at epochs 3, 4, and 7, then generally declines slightly, remaining above 60%.
### Key Observations
* The Unified model consistently outperforms the FOL and Propositional models.
* The FOL model shows relatively stable performance across all training epochs.
* The Propositional model has the lowest performance and exhibits a decline after the second epoch.
### Interpretation
The chart suggests that the Unified model is the most effective among the three for this particular task, as it consistently achieves the highest "Hits@10 Values". The FOL model provides a stable but lower performance compared to the Unified model. The Propositional model's performance is significantly lower and decreases after the initial training epochs, indicating it may not be as suitable for this task or requires further optimization. The "Hits@10 Values" metric likely represents the percentage of times the correct answer is within the top 10 results, so higher values indicate better accuracy.