## Line Chart: Hits@10 Values vs. Training Epochs
### Overview
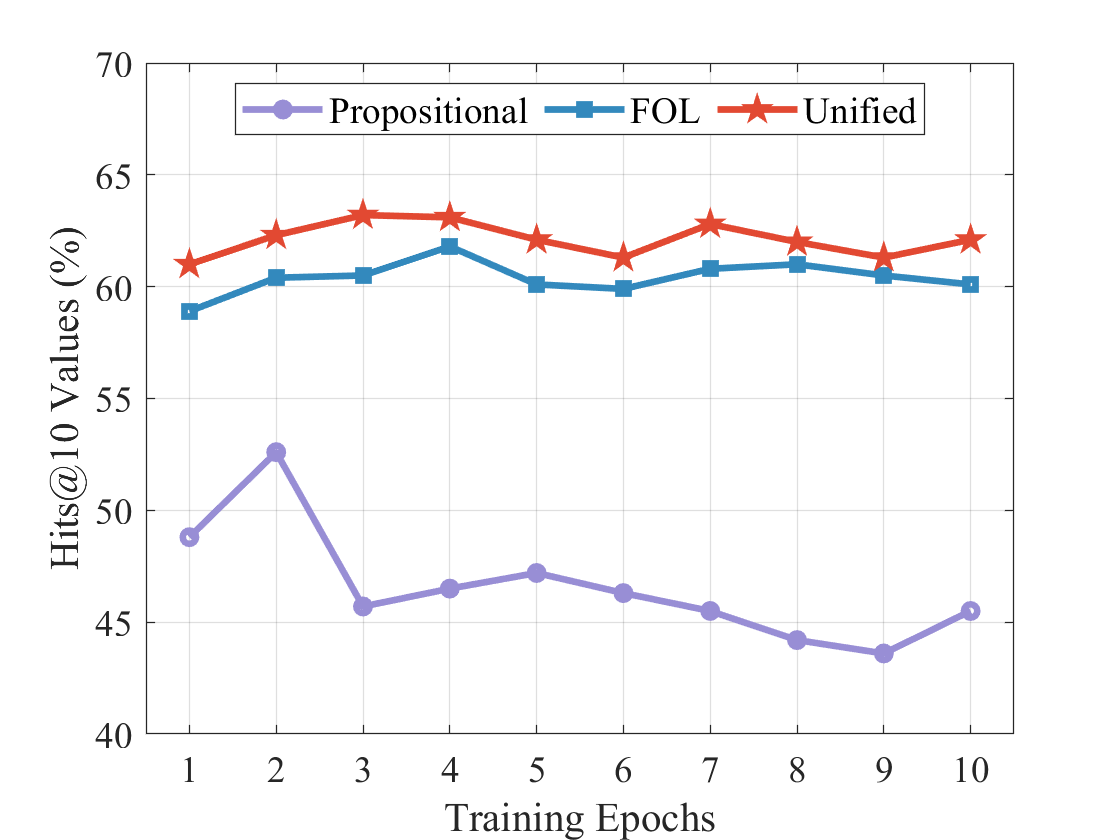
This line chart depicts the performance of three different models – Propositional, FOL (First-Order Logic), and Unified – over 10 training epochs. The performance metric is "Hits@10 Values (%)", representing the percentage of times the correct answer appears within the top 10 predicted values.
### Components/Axes
* **X-axis:** Training Epochs (ranging from 1 to 10)
* **Y-axis:** Hits@10 Values (%) (ranging from 40 to 70)
* **Legend:** Located at the top-center of the chart, identifying the three data series:
* Propositional (represented by a light purple line with circle markers)
* FOL (represented by a blue line with square markers)
* Unified (represented by a red line with star markers)
* **Gridlines:** Present to aid in reading values.
### Detailed Analysis
Let's analyze each data series individually:
**1. Propositional (Light Purple Line):**
* **Trend:** The line initially slopes sharply upward from Epoch 1 to Epoch 2, then exhibits a fluctuating downward trend with some minor increases, ending with a slight increase from Epoch 9 to Epoch 10.
* **Data Points (approximate):**
* Epoch 1: 49%
* Epoch 2: 53%
* Epoch 3: 46%
* Epoch 4: 48%
* Epoch 5: 47%
* Epoch 6: 45%
* Epoch 7: 43%
* Epoch 8: 44%
* Epoch 9: 42%
* Epoch 10: 45%
**2. FOL (Blue Line):**
* **Trend:** The line remains relatively stable, fluctuating around the 60% mark throughout the 10 epochs.
* **Data Points (approximate):**
* Epoch 1: 59%
* Epoch 2: 60%
* Epoch 3: 61%
* Epoch 4: 61%
* Epoch 5: 60%
* Epoch 6: 60%
* Epoch 7: 62%
* Epoch 8: 61%
* Epoch 9: 60%
* Epoch 10: 60%
**3. Unified (Red Line):**
* **Trend:** The line starts at a higher value than the other two, fluctuates with a slight downward trend in the middle epochs, and then increases again towards the end.
* **Data Points (approximate):**
* Epoch 1: 63%
* Epoch 2: 65%
* Epoch 3: 63%
* Epoch 4: 65%
* Epoch 5: 64%
* Epoch 6: 63%
* Epoch 7: 65%
* Epoch 8: 63%
* Epoch 9: 62%
* Epoch 10: 63%
### Key Observations
* The Unified model consistently outperforms the Propositional and FOL models across all epochs.
* The Propositional model shows the most significant fluctuation in performance.
* The FOL model exhibits the most stable performance.
* The Propositional model starts with the lowest performance and does not converge to a stable value.
### Interpretation
The chart demonstrates the effectiveness of different knowledge representation methods (Propositional, FOL, and Unified) in a learning task. The Unified model's consistently higher Hits@10 values suggest that it is the most effective at capturing relevant information and making accurate predictions. The FOL model's stability indicates that it provides a reliable, though potentially less powerful, representation. The Propositional model's fluctuating performance and lower overall values suggest that it may struggle to generalize from the training data or that it is more sensitive to the specific training examples. The initial rapid increase in the Propositional model could indicate a quick learning phase, but the subsequent decline suggests overfitting or instability. The fact that none of the models reach 100% suggests that the task is challenging and that further improvements are possible.