## Line Graph: Hits@10 Values (%) vs Training Epochs
### Overview
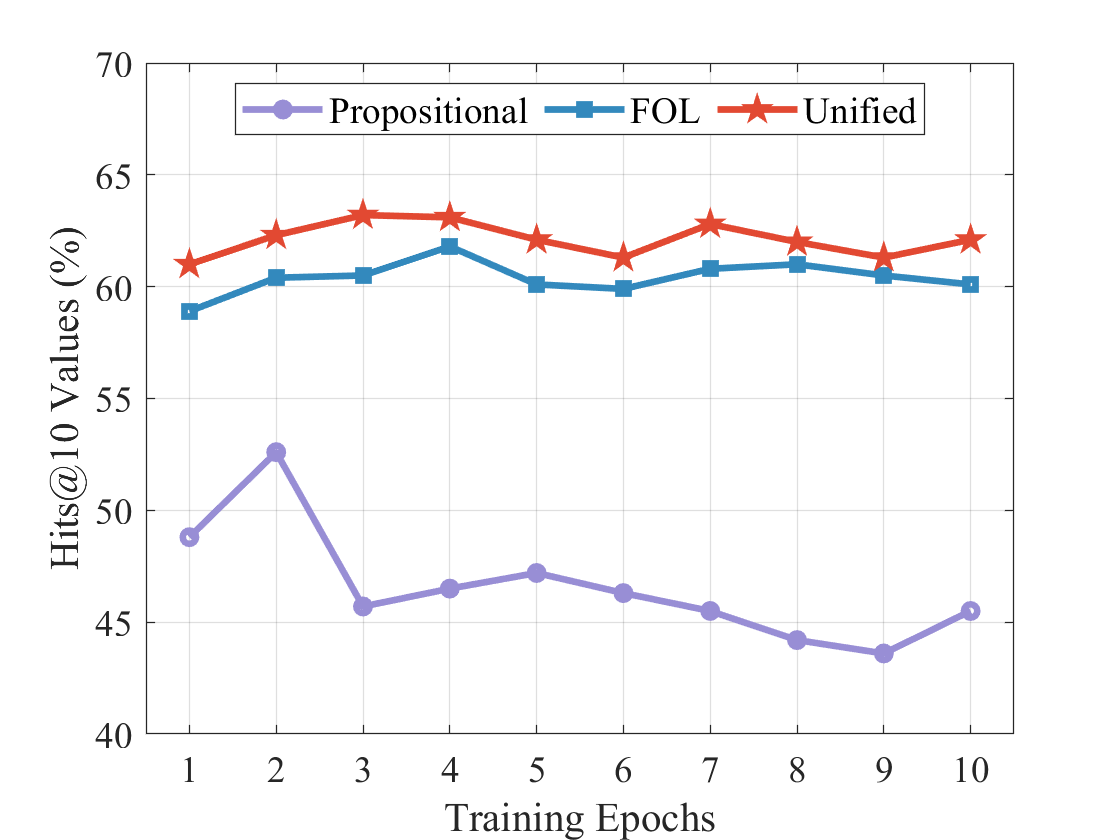
The graph compares three training strategies (Propositional, FOL, Unified) across 10 training epochs, measuring performance via Hits@10 Values (%). The y-axis ranges from 40% to 70%, and the x-axis spans epochs 1–10. Three distinct lines represent the strategies, with clear trends in performance over time.
### Components/Axes
- **X-axis**: Training Epochs (1–10, integer increments).
- **Y-axis**: Hits@10 Values (%) (40–70, 5% increments).
- **Legend**: Located in the top-right corner, with:
- **Purple circles**: Propositional
- **Blue squares**: FOL
- **Red stars**: Unified
### Detailed Analysis
1. **Propositional (Purple Circles)**:
- Starts at ~49% at epoch 1.
- Peaks at ~52% at epoch 2.
- Declines steadily to ~45% by epoch 10.
- Shows volatility after epoch 2, with minor fluctuations (e.g., ~46% at epoch 3, ~47% at epoch 5).
2. **FOL (Blue Squares)**:
- Begins at ~59% at epoch 1.
- Rises to ~62% at epoch 4.
- Stabilizes between ~60–62% from epochs 5–10.
- Minor dip to ~60% at epoch 6, then recovery.
3. **Unified (Red Stars)**:
- Starts at ~61% at epoch 1.
- Peaks at ~63% at epoch 3.
- Maintains ~61–63% across epochs 4–10.
- Slight dip to ~61% at epoch 6, then recovery.
### Key Observations
- **Propositional** exhibits the most significant decline after epoch 2, underperforming compared to other strategies.
- **FOL** shows moderate improvement early on but stabilizes, maintaining mid-range performance.
- **Unified** demonstrates the highest and most consistent performance, with minimal fluctuation.
### Interpretation
The data suggests that the **Unified** strategy is the most robust, maintaining high performance across all epochs. **FOL** performs better than **Propositional** but lags slightly behind **Unified**. The **Propositional** strategy’s sharp decline after epoch 2 indicates poor scalability or overfitting. The trends imply that training beyond epoch 2 does not benefit **Propositional**, while **FOL** and **Unified** plateau at higher performance levels. This could reflect differences in algorithmic efficiency or data utilization between the strategies.