## Scatter Plot Matrix: RSA (H+S) vs RSA (P) with SVM Decision Boundaries
### Overview
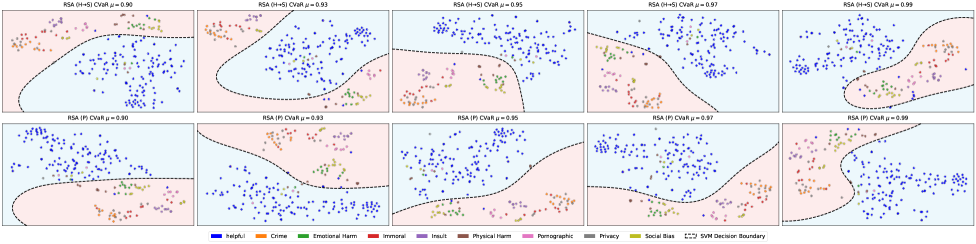
The image presents a matrix of scatter plots, each displaying data points categorized by different labels (helpful, crime, emotional harm, immoral, insult, physical harm, pornographic, privacy, social bias). Each plot shows the separation of these categories using a Support Vector Machine (SVM) decision boundary. The plots are arranged in two rows, comparing two different configurations: RSA (H+S) and RSA (P), with varying CVaR (Conditional Value at Risk) values.
### Components/Axes
* **Plot Titles:** Each plot is titled "RSA (H+S) CVaR μ = [value]" or "RSA (P) CVaR μ = [value]", where [value] ranges from 0.90 to 0.99.
* **Data Points:** Each data point is colored according to its category, as defined in the legend.
* **Decision Boundary:** A dashed black line represents the SVM decision boundary, separating the data points into two regions. The background is colored to indicate the classification regions.
* **Legend:** Located at the bottom of the image, the legend maps colors to categories:
* Blue: Helpful
* Orange: Crime
* Green: Emotional Harm
* Red: Immoral
* Purple: Insult
* Pink: Physical Harm
* Brown: Pornographic
* Gray: Privacy
* Yellow: Social Bias
* Black Dashed Line: SVM Decision Boundary
### Detailed Analysis
**Row 1: RSA (H+S)**
* **RSA (H+S) CVaR μ = 0.90:** The decision boundary separates a cluster of blue (helpful) points from a mix of other categories.
* **RSA (H+S) CVaR μ = 0.93:** The decision boundary is more complex, separating a larger cluster of blue points.
* **RSA (H+S) CVaR μ = 0.95:** The decision boundary further refines the separation, with a more pronounced curve.
* **RSA (H+S) CVaR μ = 0.97:** The decision boundary continues to adjust, isolating the blue cluster more effectively.
* **RSA (H+S) CVaR μ = 0.99:** The decision boundary shows a clear separation, with most blue points on one side and other categories on the other.
**Row 2: RSA (P)**
* **RSA (P) CVaR μ = 0.90:** The decision boundary separates the blue (helpful) points from the other categories.
* **RSA (P) CVaR μ = 0.93:** The decision boundary is more complex, separating a larger cluster of blue points.
* **RSA (P) CVaR μ = 0.95:** The decision boundary further refines the separation, with a more pronounced curve.
* **RSA (P) CVaR μ = 0.97:** The decision boundary continues to adjust, isolating the blue cluster more effectively.
* **RSA (P) CVaR μ = 0.99:** The decision boundary shows a clear separation, with most blue points on one side and other categories on the other.
### Key Observations
* The SVM decision boundary changes shape as the CVaR value increases from 0.90 to 0.99 for both RSA (H+S) and RSA (P).
* The primary goal appears to be separating the "helpful" (blue) category from the other categories.
* The decision boundaries in the RSA (H+S) plots appear slightly different from those in the RSA (P) plots for the same CVaR values, suggesting that the (H+S) and (P) configurations lead to different classification outcomes.
* The distribution of data points for each category varies across the plots.
### Interpretation
The plots demonstrate the performance of an SVM classifier in separating different categories of data, likely related to text or content analysis. The RSA (H+S) and RSA (P) configurations represent different approaches or features used in the analysis. The CVaR value likely represents a confidence level or threshold used in the classification process. As the CVaR value increases, the SVM decision boundary is refined, suggesting an attempt to improve the accuracy of the classification. The differences between the RSA (H+S) and RSA (P) plots indicate that the choice of configuration can impact the classification results. The goal is likely to identify "helpful" content and distinguish it from other categories such as "crime," "emotional harm," and "insult."