## Scatter Plot Grid: Risk-Sensitive Analysis (RSA) Decision Boundaries
### Overview
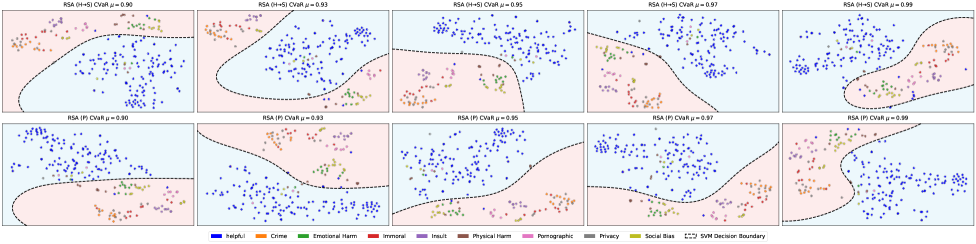
The image displays a 2x5 grid of scatter plots comparing two risk-sensitive analysis (RSA) scenarios: (H+S) and (P), across varying Conditional Value at Risk (CVaR) thresholds (μ). Each plot visualizes data point distributions with color-coded categories and a pink-shaded SVM decision boundary. CVaR μ values increase from left to right (0.90 to 0.99 in top row, 0.93 to 0.99 in bottom row).
### Components/Axes
- **X-axis**: CVaR μ (Conditional Value at Risk threshold), labeled with values 0.90, 0.93, 0.95, 0.97, 0.99
- **Y-axis**: Frequency (0-100 scale)
- **Legend**: Located at bottom center, mapping 10 categories to colors:
- Blue: Helpful
- Orange: Crime
- Green: Emotional Harm
- Red: Immoral
- Purple: Insult
- Brown: Physical Harm
- Pink: Pornographic
- Gray: Privacy
- Yellow: Social Bias
- Dashed line: SVM Decision Boundary
- **Plot Titles**: Format "RSA (H+S/P) CVaR μ = [value]"
### Detailed Analysis
1. **Top Row (H+S Scenario)**:
- μ = 0.90: Scattered points with weak boundary; pink area covers ~30% of plot
- μ = 0.93: Boundary tightens; pink area reduces to ~20%
- μ = 0.95: Clear separation; pink area ~15%
- μ = 0.97: Minimal overlap; pink area ~10%
- μ = 0.99: Almost perfect separation; pink area ~5%
2. **Bottom Row (P Scenario)**:
- μ = 0.93: Similar to H+S μ=0.93 but with more overlap
- μ = 0.95: Boundary less defined than H+S μ=0.95
- μ = 0.97: Moderate separation; pink area ~12%
- μ = 0.99: Strong boundary; pink area ~8%
3. **Data Point Distribution**:
- Blue ("Helpful") dominates lower-left quadrant across all plots
- Orange ("Crime") and Red ("Immoral") cluster in upper-right
- Yellow ("Social Bias") appears in mid-right quadrant
- Gray ("Privacy") and Pink ("Pornographic") are sparsely distributed
### Key Observations
- **Boundary Tightness**: Higher μ values (0.97-0.99) show significantly tighter decision boundaries in both scenarios
- **Scenario Comparison**: H+S consistently achieves better separation than P at equivalent μ values
- **Category Clustering**: "Helpful" (blue) remains dominant in lower-left, while "Crime" (orange) and "Immoral" (red) persist in upper-right regardless of μ
- **Anomaly**: At μ=0.99 (H+S), "Social Bias" (yellow) appears isolated in mid-right, suggesting potential outlier behavior
### Interpretation
The plots demonstrate how increasing risk aversion (higher CVaR μ) improves model discrimination between categories. The H+S scenario (top row) consistently outperforms P (bottom row) in creating tighter decision boundaries, particularly at μ≥0.95. This suggests the H+S approach better balances risk mitigation with category separation. The persistent clustering of "Helpful" and "Crime/Immoral" categories indicates these may represent fundamental data separations independent of risk parameters. The isolated "Social Bias" point at μ=0.99 (H+S) warrants investigation - it could represent a genuine outlier or indicate limitations in the feature space for detecting this category under high-risk aversion settings.