# Technical Document Extraction: Network Traffic Frequency Analysis
## 1. Image Overview
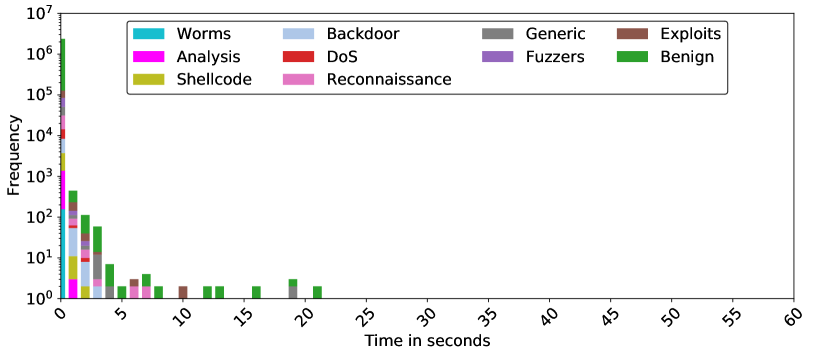
This image is a **stacked bar chart** (histogram) representing the frequency of different network traffic types over time. The Y-axis uses a logarithmic scale to accommodate a wide range of frequency values, from single occurrences to millions.
## 2. Component Isolation
### A. Header / Legend
The legend is located at the top center of the chart area, enclosed in a rounded rectangle. It contains 10 categories, each associated with a specific color:
| Category | Color |
| :--- | :--- |
| **Worms** | Cyan / Light Blue-Green |
| **Analysis** | Magenta / Bright Pink |
| **Shellcode** | Olive / Mustard Yellow |
| **Backdoor** | Light Blue / Pastel Blue |
| **DoS** | Red |
| **Reconnaissance** | Light Pink / Lavender Pink |
| **Generic** | Grey |
| **Fuzzers** | Purple |
| **Exploits** | Brown |
| **Benign** | Green |
### B. Main Chart Area (Axes)
* **Y-Axis (Vertical):**
* **Label:** Frequency
* **Scale:** Logarithmic ($10^0$ to $10^7$).
* **Markers:** $10^0$ (1), $10^1$ (10), $10^2$ (100), $10^3$ (1,000), $10^4$ (10,000), $10^5$ (100,000), $10^6$ (1,000,000), $10^7$ (10,000,000).
* **X-Axis (Horizontal):**
* **Label:** Time in seconds
* **Range:** 0 to 60 seconds.
* **Markers:** Increments of 5 (0, 5, 10, 15, 20, 25, 30, 35, 40, 45, 50, 55, 60). Labels are rotated 45 degrees.
## 3. Data Trends and Distribution
### General Trend
The data exhibits a **heavy-tailed distribution** (specifically a power-law-like decay). The vast majority of network events occur within the first 0–2 seconds. As time increases, the frequency of events drops precipitously, with very few events occurring beyond 10 seconds and no data points visible beyond approximately 22 seconds.
### Category-Specific Observations
1. **Benign (Green):** This is the most frequent category. It dominates the $t=0$ bin (reaching over $10^6$) and remains the most consistent category appearing across the timeline up to ~22 seconds.
2. **Initial Burst (0-1 seconds):** All 10 categories are present in the first bin.
* **Benign** is the highest (top of the stack).
* **Worms, Analysis, Shellcode, Backdoor, DoS, Reconnaissance, Generic, Fuzzers, and Exploits** are all visible in the stack, with frequencies ranging between $10^3$ and $10^5$.
3. **Rapid Decay (1-5 seconds):**
* At 1 second, the total frequency drops to approximately $10^{2.5}$ (~400-500).
* At 2 seconds, the frequency is around $10^2$ (100).
* At 3 seconds, it drops below $10^2$.
4. **Sparse Tail (5-22 seconds):**
* Between 5 and 10 seconds, only **Benign (Green)**, **Reconnaissance (Pink)**, and **Exploits (Brown)** appear sporadically.
* Between 10 and 22 seconds, the chart shows isolated occurrences (Frequency = 1 or 2) of **Benign (Green)** and **Generic (Grey)**.
5. **Zero Activity (22-60 seconds):** No data points are recorded for any category in the 22 to 60-second range.
## 4. Data Table Reconstruction (Estimated)
*Note: Due to the logarithmic scale and stacked nature, values are approximate orders of magnitude.*
| Time (s) | Primary Categories Present | Estimated Total Frequency |
| :--- | :--- | :--- |
| **0** | All (Benign dominant) | $> 2,000,000$ |
| **1** | Benign, Backdoor, Shellcode, Fuzzers | $\approx 500$ |
| **2** | Benign, Backdoor, DoS, Shellcode | $\approx 120$ |
| **3** | Benign, Reconnaissance, Backdoor | $\approx 60$ |
| **4** | Benign | $\approx 7$ |
| **5** | Benign | $\approx 2$ |
| **6** | Exploits, Reconnaissance | $\approx 3$ |
| **7** | Benign, Reconnaissance | $\approx 4$ |
| **10** | Exploits | $\approx 2$ |
| **12-22** | Benign, Generic (Sporadic) | $1 - 3$ |
| **23-60** | None | 0 |
## 5. Summary of Findings
The chart indicates that the network environment is characterized by high-volume, short-duration events. Benign traffic accounts for the overwhelming majority of the volume. Malicious or specialized traffic (Worms, DoS, etc.) is highly concentrated at the start of a connection or observation window (0 seconds) and dissipates almost entirely within 3 seconds.