## Sensorimotor Contingencies in a Quadruped Robot
### Overview
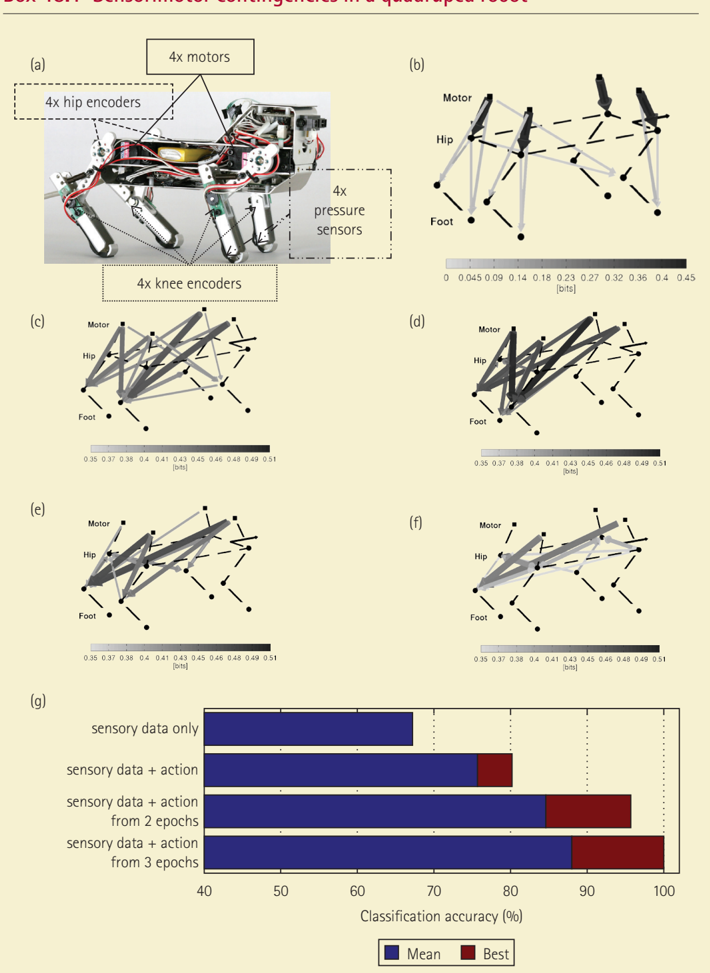
The image presents an analysis of sensorimotor contingencies in a quadruped robot. It includes a photograph of the robot with labeled components, diagrams illustrating information flow between motor, hip, and foot, and a bar chart comparing classification accuracy based on different sensory and action data combinations.
### Components/Axes
* **(a) Robot Photograph:** Shows the quadruped robot with labels indicating the locations of:
* 4x motors (top)
* 4x hip encoders (top-left)
* 4x knee encoders (bottom)
* 4x pressure sensors (right)
* **(b-f) Information Flow Diagrams:** These diagrams depict the flow of information between the motor, hip, and foot. The thickness and shade of the lines represent the strength of the connection in "bits". Each diagram has a color scale below it, ranging from light gray (0 bits) to dark gray (0.45 or 0.51 bits, depending on the diagram).
* The x-axis of the color scale is labeled with values: 0, 0.045, 0.09, 0.14, 0.18, 0.23, 0.27, 0.32, 0.36, 0.4, 0.45 [bits] for diagram (b).
* The x-axis of the color scale is labeled with values: 0.35, 0.37, 0.38, 0.4, 0.41, 0.43, 0.45, 0.46, 0.48, 0.49, 0.51 [bits] for diagrams (c), (d), (e), and (f).
* **(g) Classification Accuracy Bar Chart:** This chart compares the classification accuracy (%) for different data combinations.
* **Y-axis:** Lists the following categories:
* sensory data only
* sensory data + action
* sensory data + action from 2 epochs
* sensory data + action from 3 epochs
* **X-axis:** Classification accuracy (%), ranging from 40 to 100 in increments of 10.
* **Legend:** Located at the bottom-right of the chart, indicating:
* Blue bars represent "Mean" accuracy.
* Red bars represent "Best" accuracy.
### Detailed Analysis
* **Information Flow Diagrams (b-f):** These diagrams show the strength of connections between the motor, hip, and foot. The thickness and darkness of the lines indicate the amount of information flow.
* Diagram (b) has a lighter overall shade compared to diagrams (c), (d), (e), and (f), indicating lower information flow.
* Diagrams (c), (d), (e), and (f) show varying patterns of information flow, with some connections being stronger (darker and thicker) than others.
* **Classification Accuracy Bar Chart (g):**
* **Sensory data only:** Mean accuracy is approximately 70%, Best accuracy is approximately 70%.
* **Sensory data + action:** Mean accuracy is approximately 80%, Best accuracy is approximately 80%.
* **Sensory data + action from 2 epochs:** Mean accuracy is approximately 85%, Best accuracy is approximately 95%.
* **Sensory data + action from 3 epochs:** Mean accuracy is approximately 85%, Best accuracy is approximately 100%.
### Key Observations
* The robot is equipped with multiple sensors and actuators to gather data and perform actions.
* The information flow diagrams show the relationships between the motor, hip, and foot, with varying strengths of connections.
* The classification accuracy improves when action data is combined with sensory data.
* Increasing the number of epochs (2 or 3) further improves the best classification accuracy.
### Interpretation
The data suggests that incorporating action data into the analysis significantly improves the classification accuracy of the robot's movements. This indicates that the robot's actions are closely linked to its sensory inputs, and that understanding this relationship is crucial for accurate movement prediction and control. The increase in accuracy with more epochs suggests that the robot learns and adapts its movements over time, further refining its sensorimotor coordination. The diagrams (b-f) provide a visual representation of the information flow, highlighting the key connections between the motor, hip, and foot.