## Diagram: Sensor-motor contingencies in a quadruped robot
### Overview
This image presents a diagram illustrating sensor-motor contingencies in a quadruped robot. It consists of a photograph of the robot, followed by six scatter plots showing relationships between sensor and motor signals, and a bar chart comparing classification accuracy for different data configurations. The overall goal appears to be demonstrating how sensory data and action influence the robot's performance.
### Components/Axes
The image is divided into seven sections labeled (a) through (g).
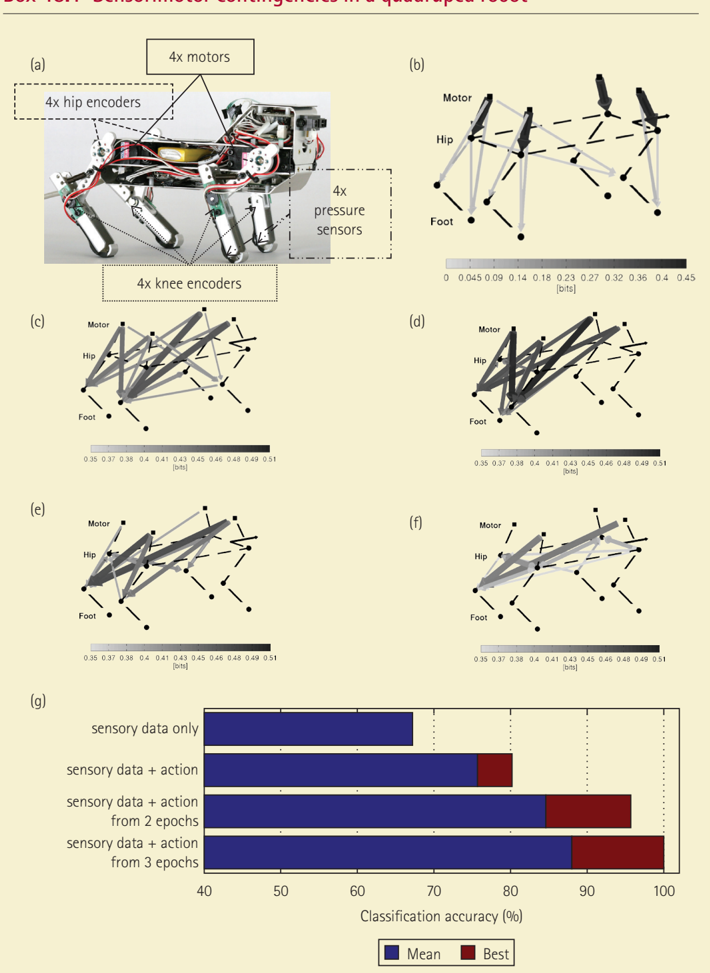
* **(a)**: A photograph of a quadruped robot with annotations indicating the location of 4x hip encoders, 4x motors, and 4x pressure sensors.
* **(b)-(f)**: Scatter plots with "Motor" on the y-axis and "Hip" and "Foot" on the x-axis. The x-axis is labeled "[bits]" and ranges from approximately 0.045 to 0.51, depending on the plot.
* **(g)**: A bar chart with "Classification accuracy (%)" on the x-axis, ranging from 40% to 100%. The y-axis represents different data configurations: "sensory data only", "sensory data + action", "sensory data + action from 2 epochs", and "sensory data + action from 3 epochs". A legend indicates "Mean" (blue) and "Best" (red) performance.
### Detailed Analysis or Content Details
**Section (a): Robot Photograph**
The photograph shows a quadruped robot. The annotations highlight:
* 4x hip encoders (located near the hip joints)
* 4x motors (presumably driving the leg joints)
* 4x pressure sensors (location not precisely specified, but likely on the feet)
**Sections (b)-(f): Scatter Plots**
Each scatter plot shows the relationship between motor signals and hip/foot sensor data. Lines connect corresponding data points for each leg.
* **(b)**: The lines generally slope upwards, indicating a positive correlation between motor signals and sensor readings. The data points are scattered, with a range of values.
* **(c)**: Similar to (b), lines slope upwards, but the data points are more clustered. The x-axis range is 0.35 to 0.51.
* **(d)**: Lines slope upwards, with a similar distribution to (c). The x-axis range is 0.35 to 0.51.
* **(e)**: Lines slope upwards, with a similar distribution to (c) and (d). The x-axis range is 0.35 to 0.51.
* **(f)**: Lines slope upwards, with a similar distribution to (c), (d), and (e). The x-axis range is 0.35 to 0.51.
**Section (g): Bar Chart**
The bar chart compares classification accuracy for different data configurations. Each configuration has two bars: one for the "Mean" and one for the "Best" accuracy.
* **Sensory data only**: Mean ≈ 55%, Best ≈ 65%
* **Sensory data + action**: Mean ≈ 75%, Best ≈ 85%
* **Sensory data + action from 2 epochs**: Mean ≈ 85%, Best ≈ 95%
* **Sensory data + action from 3 epochs**: Mean ≈ 90%, Best ≈ 98%
### Key Observations
* The scatter plots (b)-(f) consistently show a positive correlation between motor signals and sensor readings.
* The bar chart demonstrates a significant improvement in classification accuracy when action data is added to sensory data.
* Increasing the number of epochs (time steps) used for action data further improves classification accuracy.
* The "Best" accuracy is consistently higher than the "Mean" accuracy for all data configurations, indicating variability in performance.
### Interpretation
The data suggests that incorporating action information alongside sensory data is crucial for accurately modeling the robot's sensor-motor contingencies. The improvement in classification accuracy with each epoch suggests that the robot's behavior becomes more predictable and controllable as it learns from its interactions with the environment. The positive correlation observed in the scatter plots indicates that the robot's motor commands are consistently related to its sensory feedback. The difference between "Mean" and "Best" accuracy suggests that there is still room for improvement in the model's ability to generalize across different conditions or individual legs.
The diagram illustrates a key principle in robotics and control: effective control requires a closed-loop system that integrates sensory feedback and motor commands. The use of multiple epochs suggests a learning or adaptation process, where the robot refines its control strategy over time. The specific values of classification accuracy provide a quantitative measure of the robot's performance, allowing for comparison between different data configurations and potential optimization of the control system.