## Sensorimotor Contingencies in a Quadruped Robot
### Overview
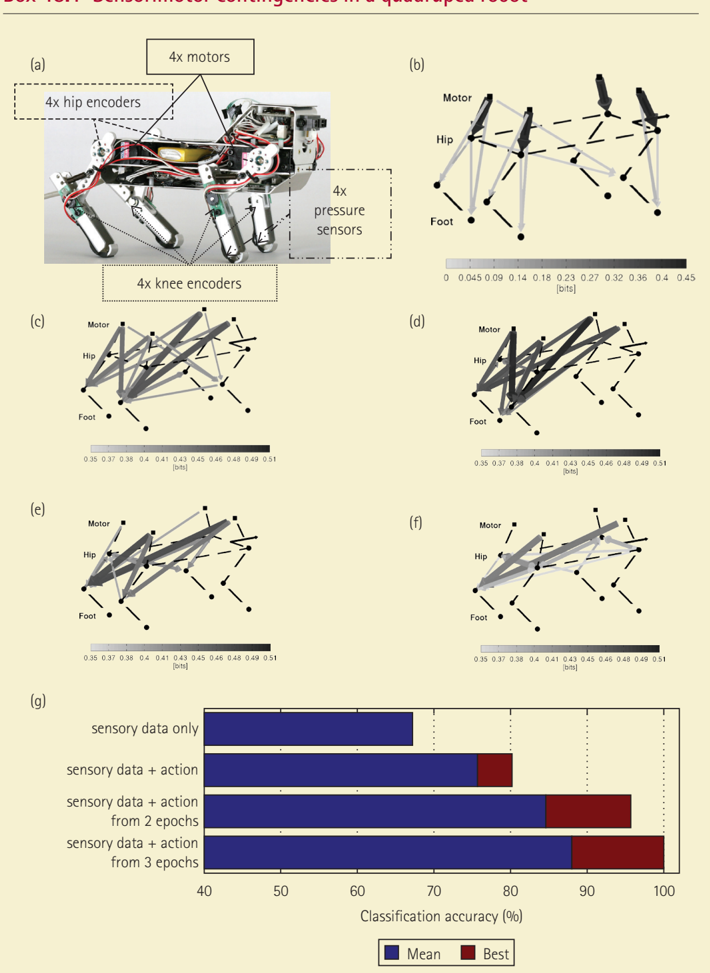
The image is a multi-panel scientific figure (labeled a-g) illustrating the sensorimotor hardware and learned connectivity patterns in a quadruped robot. It combines a photograph of the physical robot, network diagrams representing internal connectivity weights, and a bar chart showing classification accuracy under different data conditions. The overall theme is analyzing how sensory and action data contribute to the robot's internal model.
### Components/Axes
**Panel (a): Robot Hardware**
* **Image:** A photograph of a quadruped robot on a white background.
* **Labels (with leader lines pointing to components):**
* `4x motors` (pointing to the hip/leg actuators)
* `4x hip encoders` (pointing to sensors at the hip joints)
* `4x pressure sensors` (pointing to the foot pads)
* `4x knee encoders` (pointing to sensors at the knee joints)
**Panels (b-f): Network Diagrams**
* **Structure:** Each panel shows a network graph with three layers of nodes labeled `Motor`, `Hip`, and `Foot`. Nodes are connected by lines (edges) of varying thickness and grayscale intensity.
* **Legend/Scale:** Each panel has a horizontal color bar at the bottom labeled `[bits]`. The scale represents the weight or strength of the connection.
* Panel (b) scale: 0 to 0.45 bits.
* Panels (c-f) scale: 0.35 to 0.51 bits.
* **Node Labels:** `Motor` (top layer), `Hip` (middle layer), `Foot` (bottom layer).
**Panel (g): Bar Chart**
* **Chart Type:** Horizontal stacked bar chart.
* **Y-axis (Categories):**
1. `sensory data only`
2. `sensory data + action`
3. `sensory data + action from 2 epochs`
4. `sensory data + action from 3 epochs`
* **X-axis:** `Classification accuracy (%)`. Scale runs from 40 to 100, with major ticks at 40, 50, 60, 70, 80, 90, 100.
* **Legend:** Located at the bottom center.
* Blue square: `Mean`
* Red square: `Best`
### Detailed Analysis
**Panel (a) - Hardware:** The robot has four legs. Each leg is equipped with a motor, a hip encoder, a knee encoder, and a pressure sensor on the foot. This provides 16 channels of sensorimotor data (4 legs * 4 sensor types).
**Panels (b-f) - Connectivity Networks:**
* **Trend Verification:** The diagrams visualize the strength of connections between motor commands, hip sensor data, and foot pressure data. Darker, thicker lines indicate stronger connections (higher bit values).
* **Panel (b):** Shows relatively weak and sparse connections overall. The scale (0-0.45 bits) is lower than in subsequent panels. Connections are most visible between the `Hip` and `Foot` layers.
* **Panels (c), (d), (e), (f):** These show progressively stronger and more complex connectivity patterns. The scale is higher (0.35-0.51 bits). Dense, dark connections are prominent between the `Motor` and `Hip` layers, and between the `Hip` and `Foot` layers. The exact differences between these four panels are subtle and would require the original figure caption for precise interpretation (e.g., they may represent different training stages or conditions).
**Panel (g) - Classification Accuracy:**
* **Data Series & Values (Approximate):**
1. `sensory data only`: Mean ≈ 67%, Best ≈ 67% (no red segment visible).
2. `sensory data + action`: Mean ≈ 76%, Best ≈ 80% (red segment adds ~4%).
3. `sensory data + action from 2 epochs`: Mean ≈ 84%, Best ≈ 95% (red segment adds ~11%).
4. `sensory data + action from 3 epochs`: Mean ≈ 88%, Best ≈ 98% (red segment adds ~10%).
* **Trend:** Both the mean and best classification accuracy increase as more information is incorporated: from sensory data alone, to adding current action, to adding action history from previous epochs. The "Best" performance shows a dramatic improvement when action history is included.
### Key Observations
1. **Hardware-Software Link:** Panel (a) defines the physical sensorimotor channels that generate the data analyzed in the subsequent panels.
2. **Connectivity Strength:** The network diagrams (b-f) show that the internal model develops strong, specific connections between motor commands and proprioceptive (hip) data, and between proprioceptive and tactile (foot) data. The connections in (c-f) are stronger and more numerous than in (b).
3. **Action is Critical:** The bar chart (g) provides quantitative evidence that incorporating action data (both current and historical) is crucial for high classification accuracy. Sensory data alone yields mediocre performance (~67%).
4. **History Matters:** Performance improves further when the model has access to action data from multiple past epochs (2 or 3), suggesting the robot's internal model benefits from temporal context.
### Interpretation
This figure demonstrates a core principle of sensorimotor contingency theory: an agent's internal model of the world is built upon the statistical relationships between its actions and the resulting sensory changes.
* **What the data suggests:** The quadruped robot's learning algorithm successfully identifies strong, consistent patterns (contingencies) linking its motor outputs to proprioceptive feedback (hip encoders) and subsequently to tactile feedback (foot pressure). The increasing connectivity strength from panel (b) to (f) likely represents the learning process.
* **How elements relate:** The hardware (a) enables the data collection. The network diagrams (b-f) visualize the structure of the learned model. The bar chart (g) quantifies the functional utility of that model for a classification task, proving that the learned sensorimotor contingencies are informative.
* **Notable Anomaly/Insight:** The most significant finding is the disproportionate jump in "Best" accuracy when action history is included (from ~80% to ~95-98%). This implies that the most discriminative information for classification isn't just in the current sensorimotor state, but in the *sequence* of actions and sensations—the temporal dynamics of the contingency. The system isn't just mapping states; it's learning transitions.
**Language Declaration:** All text in the image is in English.