\n
## Line Chart: Average Attention Weight vs. Token Position for Different Model Layers
### Overview
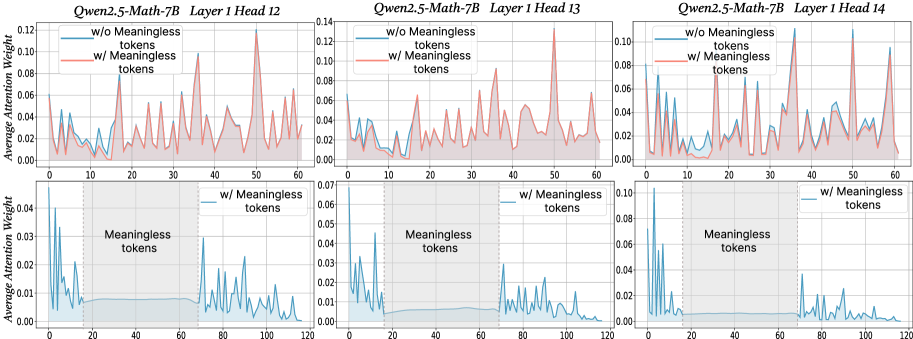
This image presents six line charts comparing the average attention weight for two conditions – with and without meaningless tokens – across different layers (12, 13, and 14) of the Qwen2.5-Math-7B model. Each chart displays the average attention weight on the y-axis against the token position on the x-axis. The top row shows charts with x-axis ranging from 0 to 60, while the bottom row shows charts with x-axis ranging from 0 to 120.
### Components/Axes
* **X-axis:** Token Position (ranging from 0 to 60 in the top row and 0 to 120 in the bottom row).
* **Y-axis:** Average Attention Weight (ranging from 0 to 0.12).
* **Legend:**
* "w/o Meaningless tokens" (represented by a red line)
* "w/ Meaningless tokens" (represented by a teal line)
* **Titles:** Each chart is titled "Qwen2.5-Math-7B Layer [Layer Number] Head [Head Number]".
* **Gridlines:** Vertical gridlines are present in each chart to aid in reading values.
### Detailed Analysis or Content Details
**Chart 1: Qwen2.5-Math-7B Layer 1 Head 12**
* The red line ("w/o Meaningless tokens") starts at approximately 0.02, fluctuates between 0.01 and 0.04, and ends around 0.03. It exhibits a generally flat trend with some oscillations.
* The teal line ("w/ Meaningless tokens") starts at approximately 0.005, rises to a peak of around 0.06 at token position 20, then declines and oscillates between 0.01 and 0.04, ending around 0.02. This line shows a more pronounced initial increase and subsequent fluctuation.
**Chart 2: Qwen2.5-Math-7B Layer 1 Head 13**
* The red line ("w/o Meaningless tokens") starts at approximately 0.01, fluctuates between 0.005 and 0.03, and ends around 0.02. Similar to Chart 1, it shows a relatively flat trend with oscillations.
* The teal line ("w/ Meaningless tokens") starts at approximately 0.005, rises to a peak of around 0.05 at token position 15, then declines and oscillates between 0.01 and 0.03, ending around 0.01.
**Chart 3: Qwen2.5-Math-7B Layer 1 Head 14**
* The red line ("w/o Meaningless tokens") starts at approximately 0.02, fluctuates between 0.01 and 0.04, and ends around 0.03. Again, a relatively flat trend with oscillations.
* The teal line ("w/ Meaningless tokens") starts at approximately 0.005, rises to a peak of around 0.06 at token position 20, then declines and oscillates between 0.01 and 0.04, ending around 0.02.
**Chart 4: Qwen2.5-Math-7B Layer 1 Head 12 (Extended X-axis)**
* The teal line ("w/ Meaningless tokens") starts at approximately 0.005, rises to a peak of around 0.04 at token position 20, then declines and oscillates between 0.01 and 0.03, ending around 0.01.
**Chart 5: Qwen2.5-Math-7B Layer 1 Head 13 (Extended X-axis)**
* The teal line ("w/ Meaningless tokens") starts at approximately 0.005, rises to a peak of around 0.05 at token position 20, then declines and oscillates between 0.01 and 0.03, ending around 0.01.
**Chart 6: Qwen2.5-Math-7B Layer 1 Head 14 (Extended X-axis)**
* The teal line ("w/ Meaningless tokens") starts at approximately 0.005, rises to a peak of around 0.06 at token position 20, then declines and oscillates between 0.01 and 0.04, ending around 0.02.
### Key Observations
* The inclusion of meaningless tokens consistently leads to a higher initial attention weight compared to the condition without meaningless tokens, particularly in the first 20-30 tokens.
* The attention weight generally decreases after the initial peak when meaningless tokens are present.
* The "w/o Meaningless tokens" lines remain relatively stable throughout the token positions, with minimal fluctuations.
* The extended x-axis charts (bottom row) show that the teal lines continue to oscillate at lower average attention weights.
### Interpretation
The data suggests that the presence of meaningless tokens initially draws attention from the model, as evidenced by the higher attention weights in the early token positions. However, this attention seems to diminish as the model processes more tokens. The relatively stable attention weights for the "w/o Meaningless tokens" condition indicate that the model focuses more consistently on relevant tokens when meaningless tokens are absent.
The differences in attention weight patterns between the two conditions highlight the model's sensitivity to irrelevant information. The initial spike in attention followed by a decline suggests that the model may initially attempt to process the meaningless tokens before recognizing their lack of significance. The extended x-axis charts demonstrate that the effect of meaningless tokens diminishes over time, but still results in a different attention pattern compared to the condition without them. This could have implications for the model's efficiency and performance on tasks requiring focused attention on relevant information.