## Multi-Panel Line Chart: Attention Weight Analysis for Qwen2.5-Math-7B
### Overview
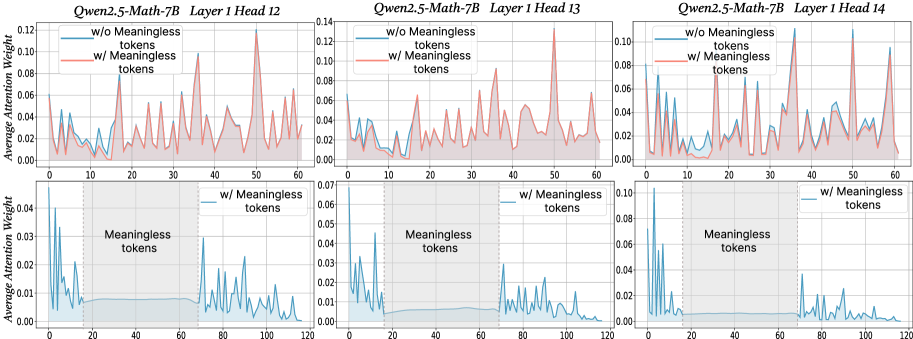
The image displays a 2x3 grid of six line charts analyzing the average attention weight distribution across token positions in specific transformer heads of the Qwen2.5-Math-7B model. The charts compare model behavior with and without the presence of "Meaningless tokens" in the input sequence.
### Components/Axes
* **Overall Structure:** Six individual plots arranged in two rows and three columns.
* **Titles:** Each plot has a title indicating the model and specific layer/head:
* Top Row (Left to Right): `Qwen2.5-Math-7B Layer 1 Head 12`, `Qwen2.5-Math-7B Layer 1 Head 13`, `Qwen2.5-Math-7B Layer 1 Head 14`.
* Bottom Row (Left to Right): Same titles as the corresponding plot above them.
* **Axes:**
* **X-axis (All plots):** Labeled with numbers representing token position. The top row plots range from 0 to 60. The bottom row plots range from 0 to 120.
* **Y-axis (All plots):** Labeled "Average Attention Weight". The scale varies per plot (e.g., 0.00 to 0.12, 0.00 to 0.14, 0.00 to 0.10).
* **Legends:**
* **Top Row Plots:** Each contains a legend with two entries:
* A blue line labeled `w/o Meaningless tokens`.
* A red line labeled `w/ Meaningless tokens`.
* **Bottom Row Plots:** Each contains a legend with one entry:
* A blue line labeled `w/ Meaningless tokens`.
* **Spatial Grounding:** Legends are consistently placed in the top-left corner of each plot area.
* **Additional Annotations (Bottom Row):** Each bottom-row plot contains a shaded gray rectangular region spanning approximately token positions 20 to 70. This region is labeled with the text "Meaningless tokens" centered within it.
### Detailed Analysis
**Top Row (Comparison: With vs. Without Meaningless Tokens, Sequence Length ~60)**
* **Trend Verification:** In all three heads (12, 13, 14), the red line (`w/ Meaningless tokens`) exhibits significantly higher and sharper peaks compared to the blue line (`w/o Meaningless tokens`). The blue line shows a more subdued, lower-amplitude pattern.
* **Data Points (Approximate):**
* **Head 12:** The red line has major peaks near positions ~15 (0.08), ~35 (0.09), and ~50 (0.12). The blue line fluctuates mostly below 0.04.
* **Head 13:** The red line shows prominent peaks near positions ~15 (0.09), ~35 (0.09), and ~50 (0.14). The blue line remains below 0.06.
* **Head 14:** The red line has sharp peaks near positions ~15 (0.09), ~35 (0.10), and ~50 (0.10). The blue line is generally below 0.06.
**Bottom Row (Focus: Effect of Meaningless Tokens, Sequence Length ~120)**
* **Trend Verification:** Each plot shows a single blue line (`w/ Meaningless tokens`). The trend is characterized by high attention weights at the very beginning (positions 0-10) and end (positions 70+) of the sequence, with a pronounced, sustained drop to near-zero values within the shaded "Meaningless tokens" region (positions ~20-70).
* **Data Points (Approximate):**
* **Head 12:** Initial peak >0.10 at position ~5. Attention drops to ~0.01 within the shaded region. Resumes spiky pattern after position 70, with peaks ~0.06.
* **Head 13:** Initial peak ~0.07 at position ~5. Attention is very low (<0.01) in the shaded region. Post-region peaks reach ~0.04.
* **Head 14:** Initial peak >0.10 at position ~5. Attention is minimal in the shaded region. Post-region peaks reach ~0.08.
### Key Observations
1. **Amplified Attention:** The presence of meaningless tokens dramatically amplifies the attention weights in specific positions (the sharp peaks in the top row), suggesting the model focuses intensely on certain tokens when meaningless content is present.
2. **Attention Collapse:** The bottom row clearly demonstrates that within a contiguous block of meaningless tokens, the average attention weight for these heads collapses to near zero. The model effectively "ignores" this segment.
3. **Head Similarity:** The three analyzed heads (Layer 1, Heads 12, 13, 14) exhibit qualitatively similar behavior, indicating this might be a common pattern in this layer of the model.
4. **Boundary Effects:** High attention is observed at the very start and immediately after the meaningless token block, suggesting the model pays special attention to the boundaries or transitions into and out of meaningless content.
### Interpretation
This data provides a technical insight into the attention mechanism of a large language model (Qwen2.5-Math-7B). The charts suggest that "meaningless tokens" (which could be filler, padding, or nonsensical text) are not processed uniformly.
* **Peircean Investigation:** The sharp peaks (the *sign*) indicate the model is actively selecting specific tokens for processing when meaningless context is present (the *object*). The near-zero attention within the meaningless block (the *interpretant*) reveals the model's learned behavior: to suppress processing of irrelevant information.
* **Functional Implication:** This behavior is likely efficient. By collapsing attention on meaningless segments, the model conserves its computational focus for meaningful parts of the input. The amplified peaks outside this region might represent the model "compensating" or re-orienting its attention after processing a block of noise.
* **Anomaly/Notable Pattern:** The most striking pattern is the stark contrast between the high-variance, peaky attention outside the meaningless block and the flat, near-zero attention inside it. This is not a gradual decline but a sharp, functional on/off switch for attention in these specific heads. This could be a deliberate architectural feature or an emergent behavior for handling noisy input.