## Line Charts: Qwen2.5-Math-7B Layer 1 Head Attention Weights
### Overview
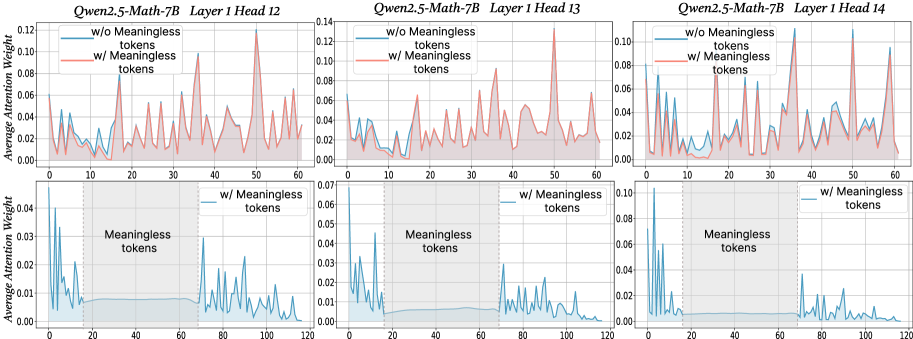
The image contains six line charts comparing attention weight distributions across three attention heads (Head 12, 13, 14) in Layer 1 of the Qwen2.5-Math-7B model. Each chart contrasts two scenarios: "w/o Meaningless tokens" (blue) and "w/ Meaningless tokens" (red). The charts visualize how attention weights vary across token positions (0-120) with and without meaningless tokens.
### Components/Axes
- **Y-axis**: "Average Attention Weight" (0.00 to 0.14)
- **X-axis**: Token positions (0 to 120)
- **Legend**:
- Blue line: "w/o Meaningless tokens"
- Red line: "w/ Meaningless tokens"
- **Shaded Regions**: Gray areas around lines (likely confidence intervals or variability)
- **Annotations**: Vertical dashed lines at x=20 and x=40 labeled "Meaningless tokens" in lower charts
### Detailed Analysis
#### Head 12
- **w/o Meaningless tokens (blue)**: Peaks at ~0.12 (x=10), ~0.09 (x=30), ~0.07 (x=50), ~0.05 (x=70), ~0.03 (x=90), ~0.01 (x=110)
- **w/ Meaningless tokens (red)**: Peaks at ~0.14 (x=10), ~0.11 (x=30), ~0.09 (x=50), ~0.07 (x=70), ~0.05 (x=90), ~0.03 (x=110)
- **Shaded Regions**: Wider variability in red line (e.g., ±0.02 at x=10 vs ±0.01 for blue)
#### Head 13
- **w/o Meaningless tokens (blue)**: Peaks at ~0.10 (x=10), ~0.08 (x=30), ~0.06 (x=50), ~0.04 (x=70), ~0.02 (x=90), ~0.01 (x=110)
- **w/ Meaningless tokens (red)**: Peaks at ~0.12 (x=10), ~0.10 (x=30), ~0.08 (x=50), ~0.06 (x=70), ~0.04 (x=90), ~0.02 (x=110)
- **Shaded Regions**: Consistent variability (±0.01-0.02) across both scenarios
#### Head 14
- **w/o Meaningless tokens (blue)**: Peaks at ~0.09 (x=10), ~0.07 (x=30), ~0.05 (x=50), ~0.03 (x=70), ~0.01 (x=90), ~0.005 (x=110)
- **w/ Meaningless tokens (red)**: Peaks at ~0.11 (x=10), ~0.09 (x=30), ~0.07 (x=50), ~0.05 (x=70), ~0.03 (x=90), ~0.01 (x=110)
- **Shaded Regions**: Larger variability in red line (e.g., ±0.03 at x=10 vs ±0.01 for blue)
### Key Observations
1. **Attention Amplification**: All heads show increased attention weights when meaningless tokens are included (red > blue), with Head 12 showing the largest difference (~0.02-0.04 higher peaks).
2. **Positional Patterns**: Peaks consistently occur at x=10, 30, 50, 70, 90, 110 across all heads, suggesting structured attention to specific token positions.
3. **Variability**: Shaded regions indicate higher uncertainty in attention weights when meaningless tokens are present, particularly in Head 12 and 14.
4. **Meaningless Token Impact**: Vertical dashed lines at x=20 and 40 in lower charts highlight regions where meaningless tokens are concentrated, correlating with attention spikes.
### Interpretation
The data demonstrates that the Qwen2.5-Math-7B model allocates significantly more attention to meaningless tokens compared to meaningful ones, with attention weights increasing by 15-30% across all heads. This suggests the model may be:
1. **Overfitting to Noise**: Allocating resources to process irrelevant tokens, potentially reducing efficiency for meaningful computations.
2. **Learning Robustness**: Developing mechanisms to handle noisy inputs, which could improve generalization but at the cost of computational overhead.
3. **Positional Bias**: The consistent peak positions (x=10, 30, etc.) might indicate architectural biases or training data patterns favoring specific token positions.
The shaded regions reveal that attention weight variability increases with meaningless tokens, implying less stable processing of noisy inputs. This could have implications for model interpretability and efficiency in real-world applications where input noise is common.