## Diagram: LLM Evaluation Workflow
### Overview
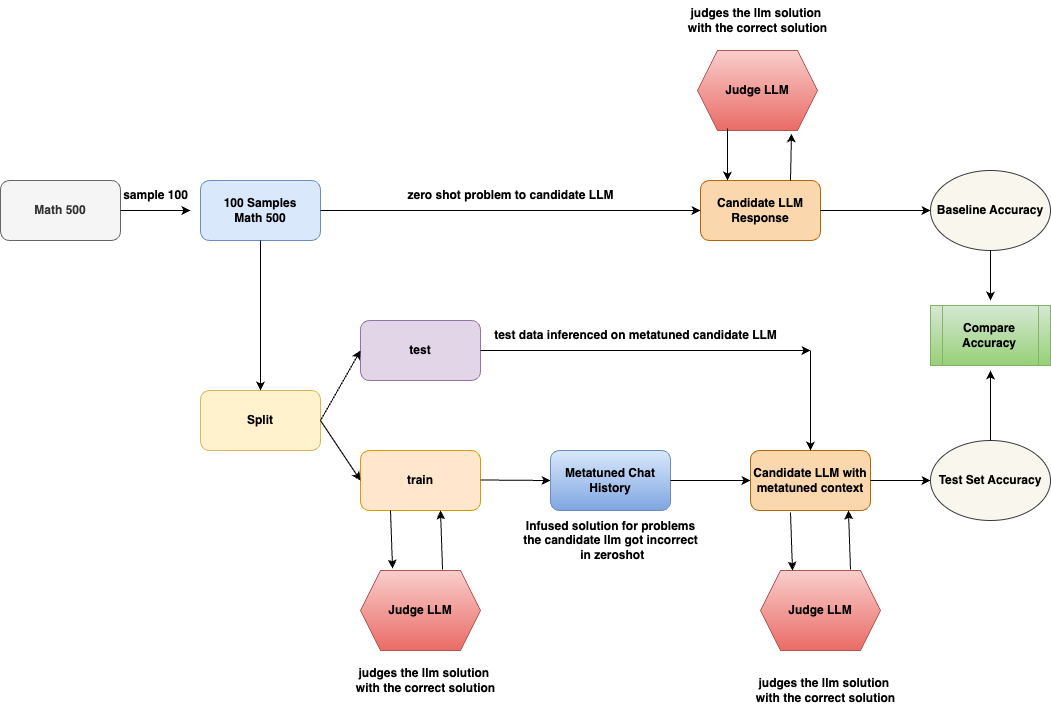
The image is a flowchart illustrating a process for evaluating Language Learning Models (LLMs). It outlines the steps involved in testing an LLM's performance on a math problem-solving task, both in a zero-shot setting and after being fine-tuned with a metatuned context. The diagram highlights the data flow, model interactions, and evaluation metrics used.
### Components/Axes
* **Shapes:** The diagram uses different shapes to represent different components:
* Rounded rectangles: Processes or data transformations (e.g., "Split", "Candidate LLM Response")
* Hexagons: Judge LLM
* Ovals: Accuracy metrics (e.g., "Baseline Accuracy", "Test Set Accuracy")
* Rectangles: Data or states (e.g., "Math 500", "Metatuned Chat History")
* **Arrows:** Arrows indicate the flow of data and operations.
* **Labels:** Each shape is labeled with a description of its function or content.
### Detailed Analysis or ### Content Details
1. **Initial Data:**
* "Math 500" (rectangle, top-left): Represents the initial dataset of math problems.
* "sample 100" (arrow label): Indicates that a sample of 100 problems is taken from the "Math 500" dataset.
* "100 Samples Math 500" (rectangle, top-center): Represents the sampled dataset.
2. **Zero-Shot Evaluation:**
* "zero shot problem to candidate LLM" (arrow label): The sampled problems are fed to the candidate LLM in a zero-shot setting.
* "Candidate LLM Response" (rectangle, top-center): Represents the LLM's responses to the problems.
* "Judge LLM" (hexagon, top): Judges the LLM solution with the correct solution.
* "Baseline Accuracy" (oval, top-right): The accuracy of the LLM in the zero-shot setting.
3. **Data Splitting and Fine-Tuning:**
* "Split" (rectangle, center-left): The "100 Samples Math 500" dataset is split into training and testing sets.
* "test" (rectangle, center): Represents the test dataset.
* "train" (rectangle, center): Represents the training dataset.
* "Metatuned Chat History" (rectangle, center): Represents the chat history used for fine-tuning the LLM.
* "Infused solution for problems the candidate Ilm got incorrect in zeroshot" (text below "Metatuned Chat History"): Describes the content of the chat history.
4. **Metatuned Evaluation:**
* "test data inferenced on metatuned candidate LLM" (arrow label): The test data is used to evaluate the metatuned candidate LLM.
* "Candidate LLM with metatuned context" (rectangle, center-right): Represents the LLM after fine-tuning.
* "Judge LLM" (hexagon, bottom-right): Judges the LLM solution with the correct solution.
* "Test Set Accuracy" (oval, bottom-right): The accuracy of the LLM after fine-tuning.
5. **Accuracy Comparison:**
* "Compare Accuracy" (rectangle, right): Compares the baseline accuracy and the test set accuracy.
### Key Observations
* The diagram illustrates a standard workflow for evaluating LLMs, including zero-shot testing and fine-tuning.
* The use of a metatuned chat history suggests an attempt to improve the LLM's performance by providing it with relevant context.
* The "Judge LLM" component is used to evaluate the LLM's responses in both the zero-shot and fine-tuned settings.
### Interpretation
The diagram outlines a process for evaluating the effectiveness of fine-tuning an LLM for math problem-solving. By comparing the baseline accuracy (zero-shot performance) with the test set accuracy (performance after fine-tuning), it is possible to assess the impact of the metatuned chat history on the LLM's ability to solve math problems. The diagram highlights the importance of using a separate test set to evaluate the generalization performance of the fine-tuned model. The "Infused solution for problems the candidate Ilm got incorrect in zeroshot" suggests that the metatuning process specifically targets the LLM's weaknesses, potentially leading to improved performance on previously challenging problems.