\n
## Bar Charts: Performance Comparison of Baseline and ARM Models
### Overview
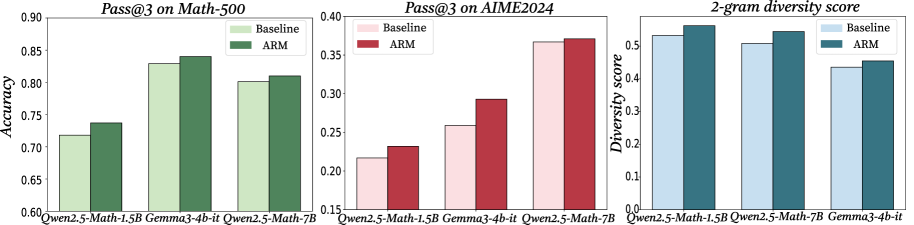
The image presents three bar charts comparing the performance of "Baseline" and "ARM" models across three different metrics: Pass@3 on Math-500, Pass@3 on AIME2024, and 2-gram diversity score. The x-axis of each chart represents different models: Qwen2.5-Math-1.5B, Gemma3-4b-it, and Qwen2.5-Math-7B.
### Components/Axes
* **Chart 1:**
* Title: "Pass@3 on Math-500"
* X-axis: Model names (Qwen2.5-Math-1.5B, Gemma3-4b-it, Qwen2.5-Math-7B)
* Y-axis: Accuracy (ranging from 0.60 to 0.90)
* Legend:
* Baseline (Light Green)
* ARM (Dark Green)
* **Chart 2:**
* Title: "Pass@3 on AIME2024"
* X-axis: Model names (Qwen2.5-Math-1.5B, Gemma3-4b-it, Qwen2.5-Math-7B)
* Y-axis: Pass@3 Score (ranging from 0.15 to 0.40)
* Legend:
* Baseline (Light Red)
* ARM (Dark Red)
* **Chart 3:**
* Title: "2-gram diversity score"
* X-axis: Model names (Qwen2.5-Math-1.5B, Gemma3-4b-it, Qwen2.5-Math-7B)
* Y-axis: Diversity score (ranging from 0.1 to 0.6)
* Legend:
* Baseline (Light Blue)
* ARM (Dark Blue)
### Detailed Analysis or Content Details
**Chart 1: Pass@3 on Math-500**
* Qwen2.5-Math-1.5B: Baseline ≈ 0.72, ARM ≈ 0.78
* Gemma3-4b-it: Baseline ≈ 0.82, ARM ≈ 0.85
* Qwen2.5-Math-7B: Baseline ≈ 0.85, ARM ≈ 0.88
* Trend: ARM consistently outperforms Baseline across all models. The performance increases with model size.
**Chart 2: Pass@3 on AIME2024**
* Qwen2.5-Math-1.5B: Baseline ≈ 0.22, ARM ≈ 0.28
* Gemma3-4b-it: Baseline ≈ 0.32, ARM ≈ 0.30
* Qwen2.5-Math-7B: Baseline ≈ 0.36, ARM ≈ 0.38
* Trend: ARM generally outperforms Baseline, but the difference is smaller than in the Math-500 chart. Gemma3-4b-it shows a slight decrease in ARM performance compared to Baseline.
**Chart 3: 2-gram diversity score**
* Qwen2.5-Math-1.5B: Baseline ≈ 0.52, ARM ≈ 0.55
* Gemma3-4b-it: Baseline ≈ 0.58, ARM ≈ 0.57
* Qwen2.5-Math-7B: Baseline ≈ 0.60, ARM ≈ 0.60
* Trend: ARM and Baseline perform similarly, with slight variations. The diversity score appears relatively stable across different models.
### Key Observations
* ARM consistently improves accuracy on the Math-500 dataset.
* The performance gain from ARM is less pronounced on the AIME2024 dataset, and even slightly negative for Gemma3-4b-it.
* The 2-gram diversity score is relatively consistent across models and between Baseline and ARM.
* Larger models (Qwen2.5-Math-7B) generally achieve higher accuracy on Math-500.
### Interpretation
The data suggests that the ARM technique is effective in improving performance on the Math-500 benchmark, indicating its ability to enhance mathematical reasoning capabilities. However, its impact on the AIME2024 benchmark is less significant, and in some cases, slightly detrimental. This could indicate that ARM is more specialized for mathematical problem-solving than general reasoning tasks. The consistent 2-gram diversity scores suggest that ARM does not significantly alter the diversity of generated responses. The positive correlation between model size and accuracy on Math-500 highlights the importance of model capacity for complex mathematical tasks. The slight dip in ARM performance for Gemma3-4b-it on AIME2024 could be due to specific characteristics of that model or dataset interaction. Further investigation is needed to understand the reasons behind this anomaly.