## Bar Charts: Model Performance Comparison
### Overview
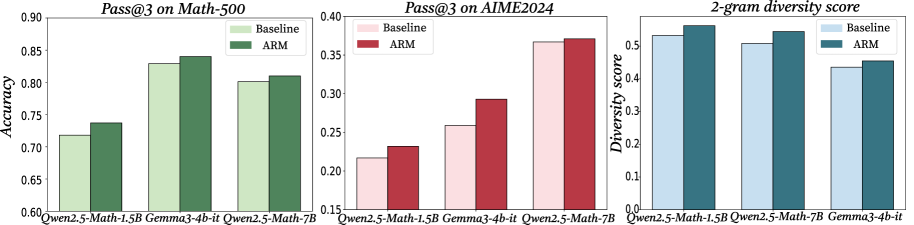
The image displays three separate bar charts arranged horizontally, comparing the performance of three different AI models ("Qwen2.5-Math-1.5B", "Gemma3-4b-it", and "Qwen2.5-Math-7B") under two conditions: "Baseline" and "ARM". The charts measure different metrics: accuracy on a math dataset, performance on a competition dataset, and output diversity.
### Components/Axes
* **Chart 1 (Left):**
* **Title:** `Pass@3 on Math-500`
* **Y-axis:** Label is `Accuracy`. Scale ranges from 0.60 to 0.90, with major ticks at 0.05 intervals.
* **X-axis:** Lists three models: `Qwen2.5-Math-1.5B`, `Gemma3-4b-it`, `Qwen2.5-Math-7B`.
* **Legend:** Located in the top-right corner. `Baseline` is represented by light green bars. `ARM` is represented by dark green bars.
* **Chart 2 (Center):**
* **Title:** `Pass@3 on AIME2024`
* **Y-axis:** No explicit label, but the title implies it's Pass@3 score. Scale ranges from 0.15 to 0.40, with major ticks at 0.05 intervals.
* **X-axis:** Lists the same three models as Chart 1.
* **Legend:** Located in the top-right corner. `Baseline` is represented by light pink bars. `ARM` is represented by dark red bars.
* **Chart 3 (Right):**
* **Title:** `2-gram diversity score`
* **Y-axis:** Label is `Diversity score`. Scale ranges from 0.0 to 0.5, with major ticks at 0.1 intervals.
* **X-axis:** Lists the same three models, but in a different order: `Qwen2.5-Math-1.5B`, `Qwen2.5-Math-7B`, `Gemma3-4b-it`.
* **Legend:** Located in the top-right corner. `Baseline` is represented by light blue bars. `ARM` is represented by dark teal/blue bars.
### Detailed Analysis
**Chart 1: Pass@3 on Math-500 (Accuracy)**
* **Trend Verification:** For all three models, the ARM bar (dark green) is taller than the Baseline bar (light green), indicating improved accuracy.
* **Data Points (Approximate):**
* **Qwen2.5-Math-1.5B:** Baseline ≈ 0.72, ARM ≈ 0.74
* **Gemma3-4b-it:** Baseline ≈ 0.83, ARM ≈ 0.84
* **Qwen2.5-Math-7B:** Baseline ≈ 0.80, ARM ≈ 0.81
**Chart 2: Pass@3 on AIME2024**
* **Trend Verification:** For all three models, the ARM bar (dark red) is taller than the Baseline bar (light pink), indicating improved performance on this more challenging dataset.
* **Data Points (Approximate):**
* **Qwen2.5-Math-1.5B:** Baseline ≈ 0.22, ARM ≈ 0.23
* **Gemma3-4b-it:** Baseline ≈ 0.26, ARM ≈ 0.29
* **Qwen2.5-Math-7B:** Baseline ≈ 0.37, ARM ≈ 0.375 (very slight improvement)
**Chart 3: 2-gram Diversity Score**
* **Trend Verification:** For all three models, the ARM bar (dark teal) is taller than the Baseline bar (light blue), indicating increased output diversity.
* **Data Points (Approximate):**
* **Qwen2.5-Math-1.5B:** Baseline ≈ 0.52, ARM ≈ 0.55
* **Qwen2.5-Math-7B:** Baseline ≈ 0.51, ARM ≈ 0.54
* **Gemma3-4b-it:** Baseline ≈ 0.44, ARM ≈ 0.46
### Key Observations
1. **Consistent Improvement:** The "ARM" method consistently improves performance over the "Baseline" across all three models and all three measured metrics (Math-500 accuracy, AIME2024 score, and 2-gram diversity).
2. **Model Scaling:** The larger model, Qwen2.5-Math-7B, generally achieves higher absolute scores than the smaller Qwen2.5-Math-1.5B on the accuracy and competition tasks, as expected.
3. **Task Difficulty:** Scores on the AIME2024 dataset are significantly lower (0.22-0.375) than on the Math-500 dataset (0.72-0.84), indicating AIME2024 is a much harder benchmark.
4. **Diversity vs. Performance:** The improvement in diversity score (Chart 3) correlates with the improvement in task performance (Charts 1 & 2), suggesting the ARM method may enhance both the quality and variety of model outputs.
### Interpretation
The data demonstrates the effectiveness of the "ARM" technique as a method for enhancing the capabilities of mathematical reasoning models. It provides a dual benefit: it boosts the models' accuracy on both standard (Math-500) and highly challenging (AIME2024) problem-solving tasks, while simultaneously increasing the lexical diversity of their generated solutions. This suggests ARM doesn't simply make the models more confident in a single line of reasoning but may encourage a more robust and varied exploration of solution paths. The consistent positive effect across models of different sizes (1.5B and 7B parameters) and architectures (Qwen and Gemma) indicates that ARM is a broadly applicable improvement technique rather than being model-specific. The most significant relative gains appear on the hardest task (AIME2024) for the mid-sized model (Gemma3-4b-it), hinting that the technique might be particularly valuable for pushing performance boundaries on difficult problems.