## Bar Charts: Model Performance Comparison
### Overview
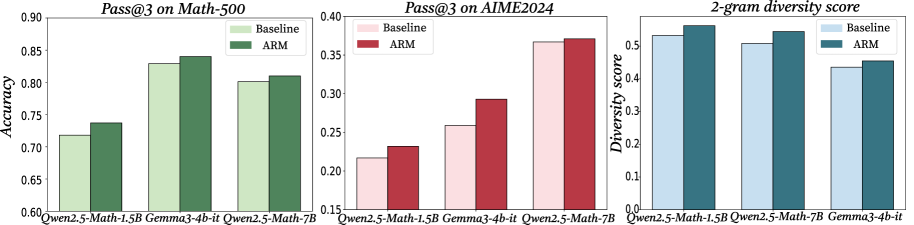
The image contains three grouped bar charts comparing the performance of three AI models (Qwen2.5-Math-1.5B, Gemma3-4b-it, Qwen2.5-Math-7B) across three metrics: Pass@3 on Math-500, Pass@3 on AIME2024, and 2-gram diversity score. Each chart compares two configurations: Baseline and ARM (Adaptive Response Mechanism).
### Components/Axes
1. **X-Axes**:
- Math-500: Qwen2.5-Math-1.5B | Gemma3-4b-it | Qwen2.5-Math-7B
- AIME2024: Same model categories
- Diversity Score: Same model categories
2. **Y-Axes**:
- Math-500/AIME2024: Accuracy (0.6–0.9)
- Diversity Score: Diversity score (0.0–0.5)
3. **Legends**:
- Top-right corner in all charts
- Baseline: Light green (Math-500), Light pink (AIME2024), Light blue (Diversity)
- ARM: Dark green (Math-500), Dark red (AIME2024), Dark blue (Diversity)
### Detailed Analysis
#### Pass@3 on Math-500
- **Qwen2.5-Math-1.5B**: Baseline ~0.72 | ARM ~0.74
- **Gemma3-4b-it**: Baseline ~0.83 | ARM ~0.84
- **Qwen2.5-Math-7B**: Baseline ~0.81 | ARM ~0.82
- **Trend**: ARM consistently outperforms Baseline by ~0.02–0.03 across all models.
#### Pass@3 on AIME2024
- **Qwen2.5-Math-1.5B**: Baseline ~0.22 | ARM ~0.24
- **Gemma3-4b-it**: Baseline ~0.26 | ARM ~0.29
- **Qwen2.5-Math-7B**: Baseline ~0.36 | ARM ~0.37
- **Trend**: ARM shows larger gains for smaller models (Gemma3-4b-it +0.03) but minimal improvement for larger models (Qwen2.5-Math-7B +0.01).
#### 2-gram Diversity Score
- **Qwen2.5-Math-1.5B**: Baseline ~0.52 | ARM ~0.55
- **Qwen2.5-Math-7B**: Baseline ~0.51 | ARM ~0.54
- **Gemma3-4b-it**: Baseline ~0.44 | ARM ~0.46
- **Trend**: ARM improves diversity for all models, but Gemma3-4b-it lags significantly (~0.02 lower than ARM).
### Key Observations
1. **ARM Advantage**: ARM improves accuracy in Math-500 (avg. +0.025) and AIME2024 (avg. +0.023), with stronger gains for smaller models.
2. **Diversity Trade-off**: Larger models (Qwen2.5-Math-7B) maintain high diversity but show diminishing returns with ARM.
3. **Gemma3-4b-it Anomaly**: Underperforms in diversity despite matching Qwen2.5-Math-1.5B in ARM accuracy gains.
### Interpretation
The data suggests ARM enhances model performance across tasks, with smaller models benefiting more from the mechanism. However, Gemma3-4b-it's lower diversity score raises questions about output variability despite its strong accuracy. The Qwen2.5-Math-7B model maintains high diversity but shows minimal ARM improvement, indicating potential saturation in larger models. These findings highlight a trade-off between accuracy gains and output diversity when implementing ARM, particularly for mid-sized models like Gemma3-4b-it.