## Charts: Model Performance Metrics
### Overview
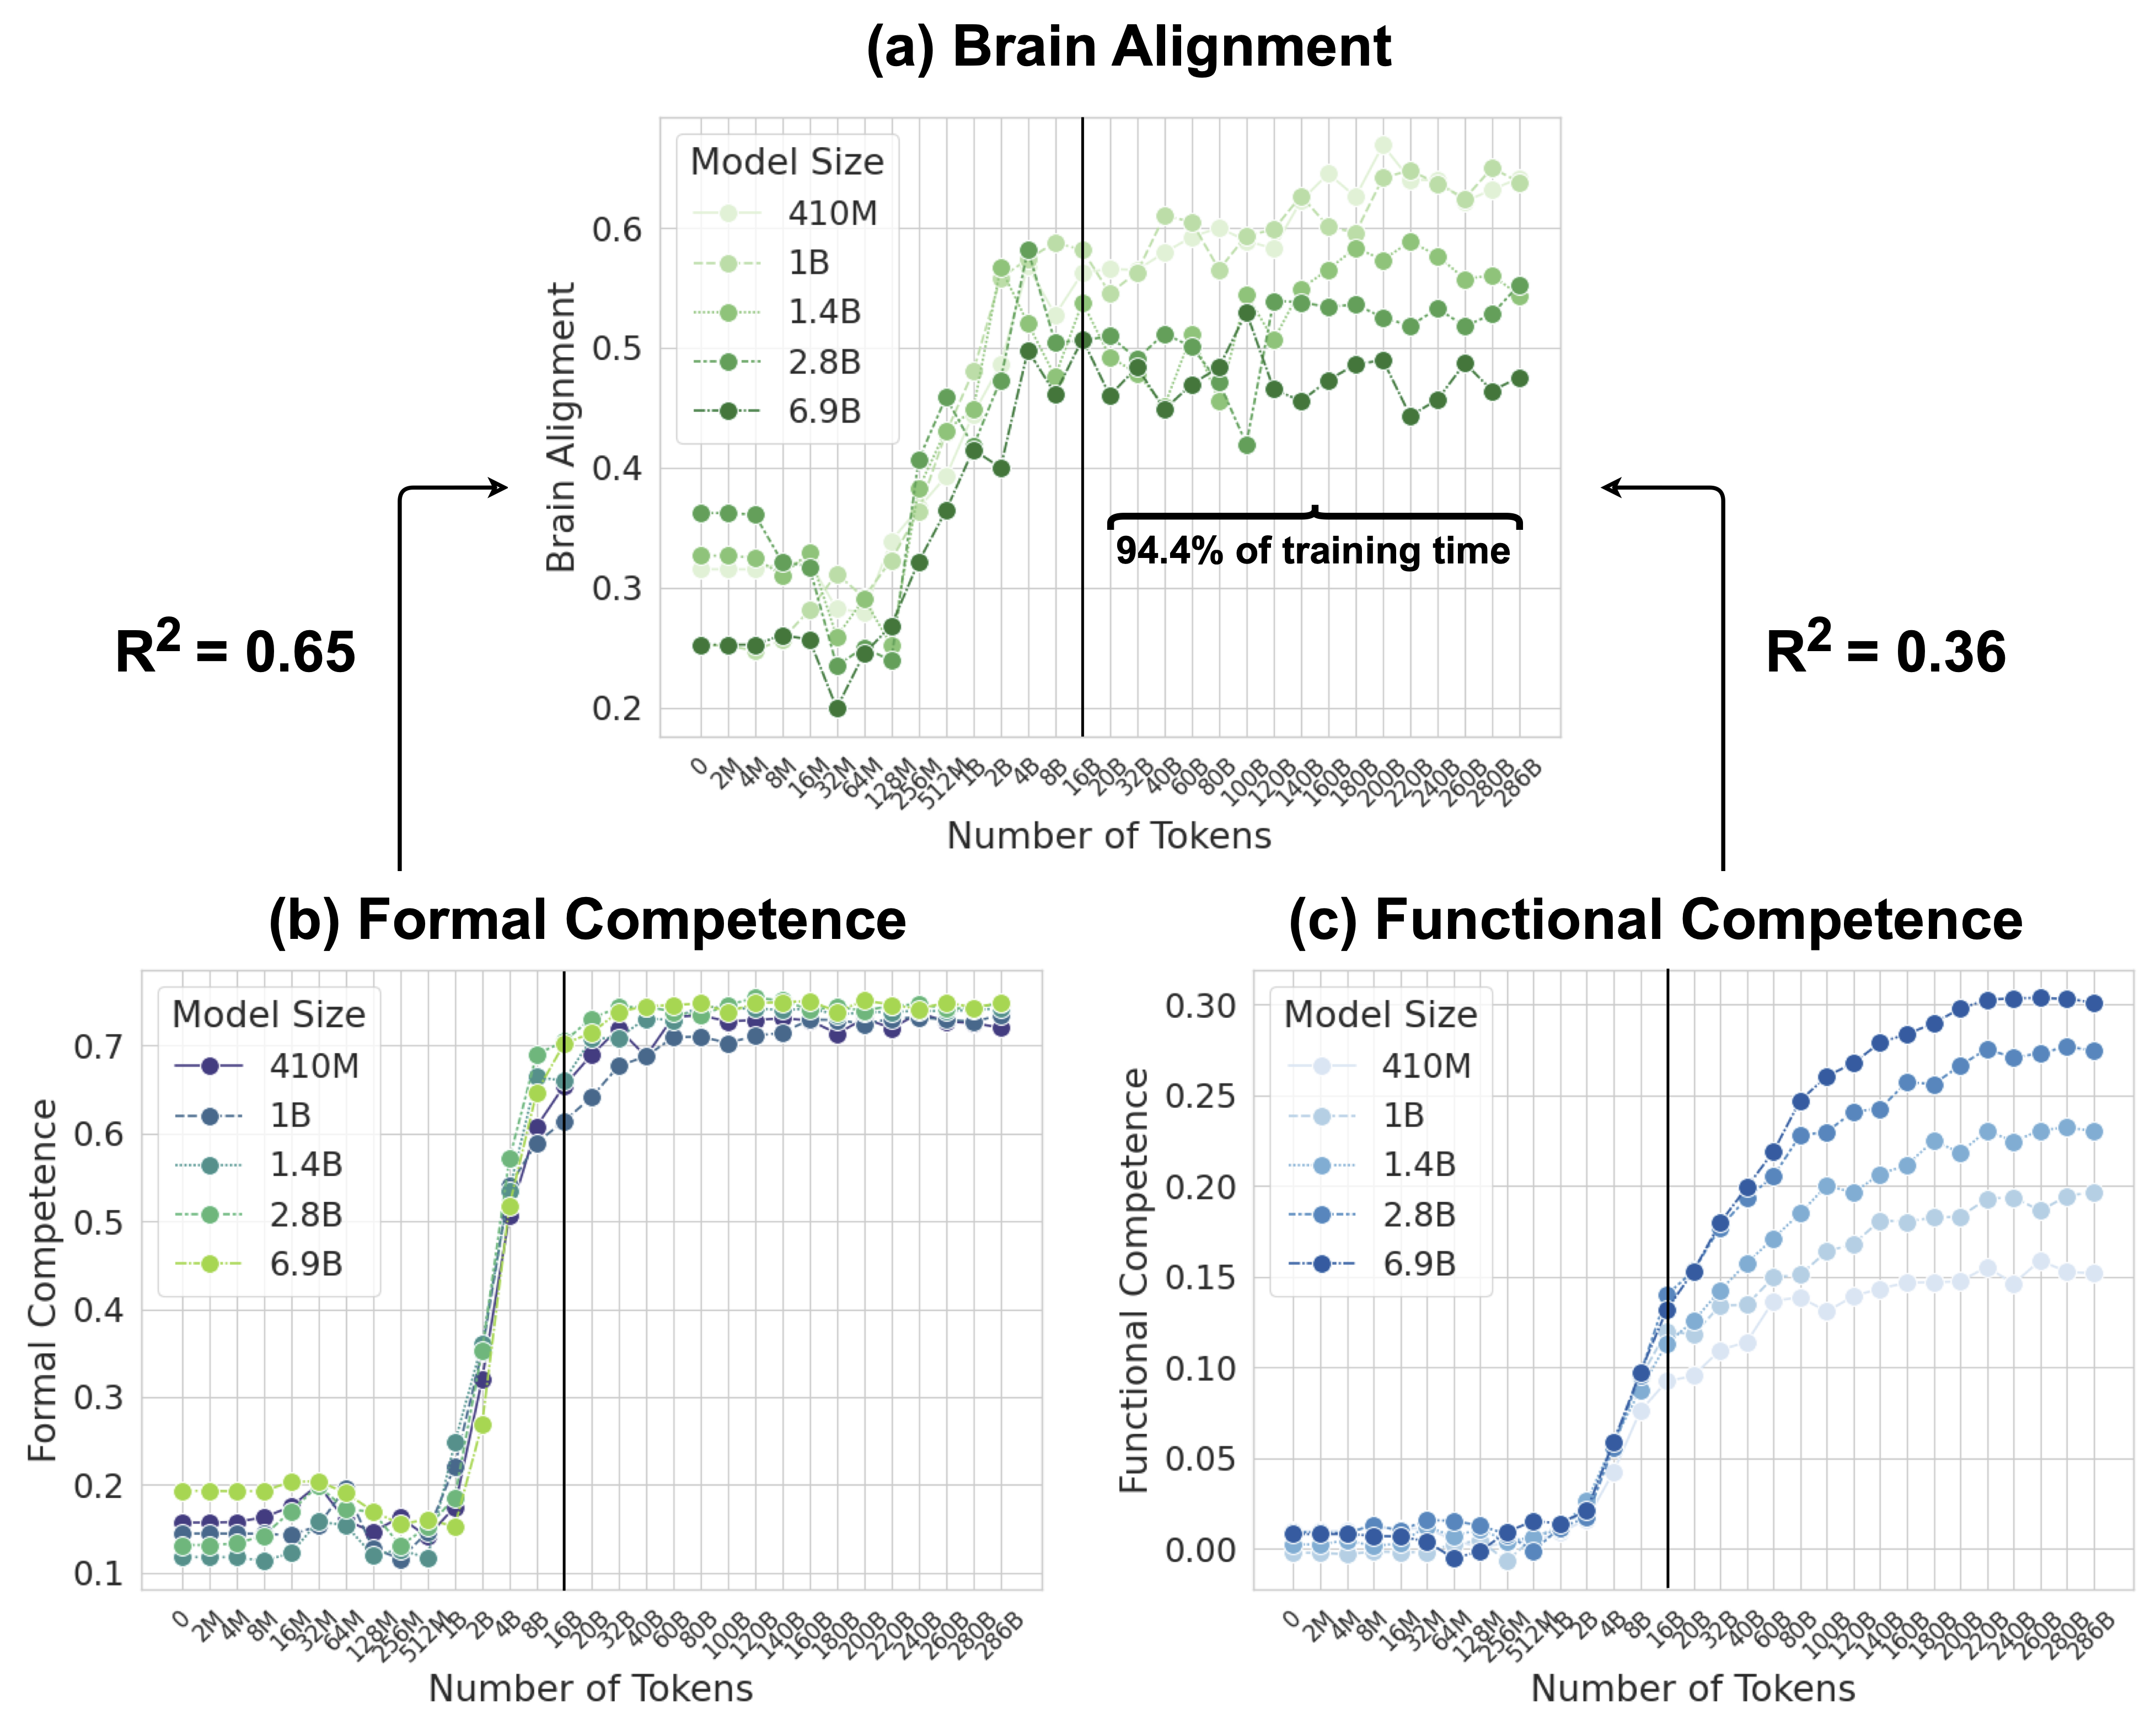
The image presents three scatter plots (a, b, and c) illustrating the performance of different language models (410M, 1B, 1.4B, 2.8B, and 6.9B parameters) across three metrics: Brain Alignment, Formal Competence, and Functional Competence. The x-axis of each plot represents the number of tokens processed during training, and the y-axis represents the corresponding metric value. Each plot includes an R-squared value and a vertical dashed line indicating 94.4% of the training time.
### Components/Axes
* **X-axis (all plots):** Number of Tokens. Scale: 2M to 300B, with markers at 2M, 10M, 50M, 100M, 200M, 500M, 1B, 2B, 5B, 10B, 20B, 50B, 100B, 200B, 300B.
* **Y-axis (a):** Brain Alignment. Scale: 0.2 to 0.6, with markers at 0.2, 0.3, 0.4, 0.5, 0.6.
* **Y-axis (b):** Formal Competence. Scale: 0.1 to 0.7, with markers at 0.1, 0.2, 0.3, 0.4, 0.5, 0.6, 0.7.
* **Y-axis (c):** Functional Competence. Scale: 0.0 to 0.3, with markers at 0.0, 0.05, 0.1, 0.15, 0.2, 0.25, 0.3.
* **Legend (all plots):**
* 410M (Light Green)
* 1B (Dark Green)
* 1.4B (Teal)
* 2.8B (Blue)
* 6.9B (Purple)
* **R-squared values:** R² = 0.65 (left side of plot a), R² = 0.36 (right side of plot a).
* **Training Time Marker:** Vertical dashed line at approximately 20B tokens, labeled "94.4% of training time".
### Detailed Analysis or Content Details
**Plot (a): Brain Alignment**
* **410M:** Starts at approximately 0.22, remains relatively flat around 0.25 until approximately 50B tokens, then increases slightly to around 0.28.
* **1B:** Starts at approximately 0.23, increases rapidly to around 0.55 by 50B tokens, then plateaus around 0.58.
* **1.4B:** Starts at approximately 0.24, increases rapidly to around 0.60 by 50B tokens, then plateaus around 0.62.
* **2.8B:** Starts at approximately 0.25, increases rapidly to around 0.58 by 50B tokens, then plateaus around 0.60.
* **6.9B:** Starts at approximately 0.26, increases rapidly to around 0.55 by 50B tokens, then plateaus around 0.58.
* The R-squared value of 0.65 applies to the initial portion of the curves (before the plateau), while 0.36 applies to the plateau region.
**Plot (b): Formal Competence**
* **410M:** Remains consistently low around 0.10 across all token counts.
* **1B:** Remains consistently low around 0.10 across all token counts.
* **1.4B:** Remains consistently low around 0.10 across all token counts.
* **2.8B:** Increases rapidly from approximately 0.10 to around 0.70 by 50B tokens, then plateaus.
* **6.9B:** Increases rapidly from approximately 0.10 to around 0.70 by 50B tokens, then plateaus.
**Plot (c): Functional Competence**
* **410M:** Remains consistently low around 0.01 across all token counts.
* **1B:** Remains consistently low around 0.01 across all token counts.
* **1.4B:** Remains consistently low around 0.01 across all token counts.
* **2.8B:** Increases gradually from approximately 0.01 to around 0.15 by 200B tokens, then increases more rapidly to around 0.25 by 300B tokens.
* **6.9B:** Increases gradually from approximately 0.01 to around 0.10 by 200B tokens, then increases more rapidly to around 0.30 by 300B tokens.
### Key Observations
* Brain Alignment plateaus for all models after approximately 50B tokens.
* Formal Competence shows a clear divergence between smaller models (410M, 1B, 1.4B) and larger models (2.8B, 6.9B).
* Functional Competence exhibits a more gradual increase compared to Brain Alignment and Formal Competence, and continues to improve even after 200B tokens.
* The R-squared values suggest a stronger correlation between the number of tokens and Brain Alignment in the initial training phase.
* The 94.4% training time marker highlights the point at which the models have processed the majority of their training data.
### Interpretation
The data suggests that increasing model size significantly improves Brain Alignment and Formal Competence, but the gains diminish after a certain point (around 50B tokens). Functional Competence, however, continues to improve with more training data, even for the larger models. The plateau in Brain Alignment could indicate that the models are reaching a limit in their ability to align with human brain activity, or that the metric itself is not sensitive enough to capture further improvements. The divergence in Formal Competence highlights the importance of model size for achieving strong performance on formal tasks. The continued improvement in Functional Competence suggests that more training data is beneficial for developing practical skills. The R-squared values provide a quantitative measure of the strength of the relationship between training data and performance, and the difference between the two values in plot (a) suggests a change in the underlying dynamics of the training process. The vertical line at 94.4% of training time is a useful reference point for understanding the performance of the models at different stages of training.