## Multi-Metric Model Performance Analysis
### Overview
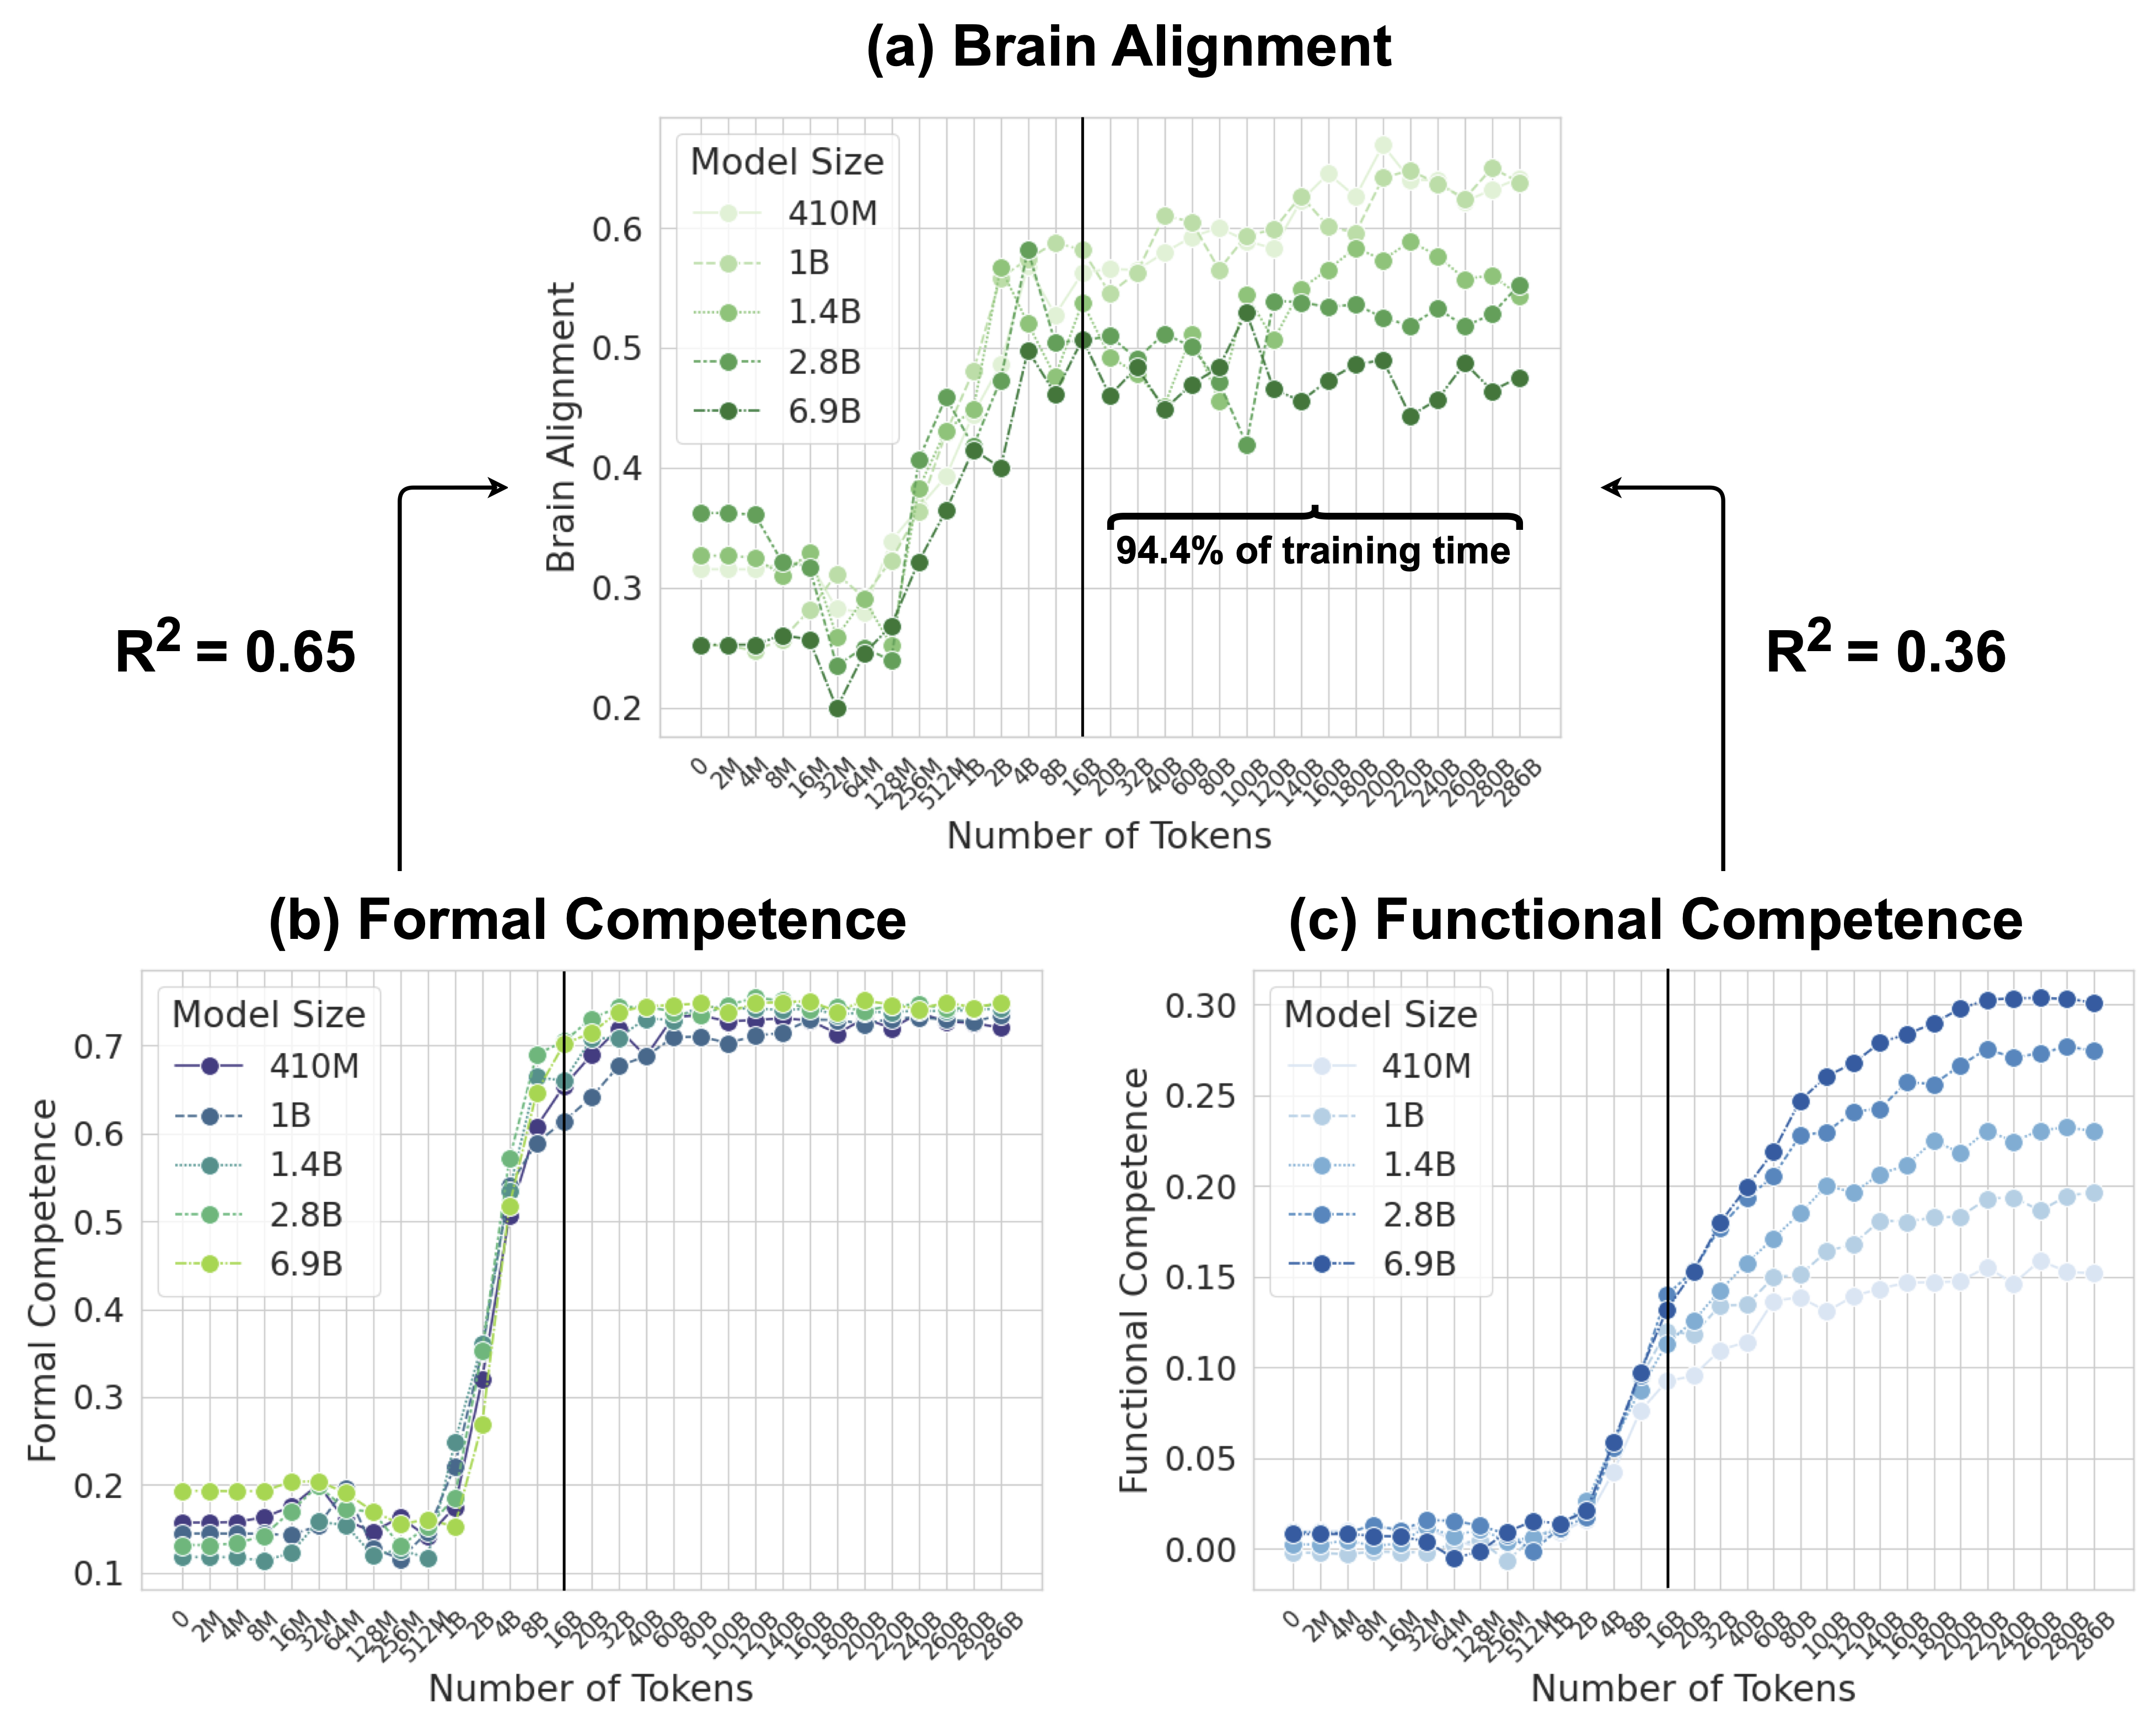
The image presents three comparative graphs analyzing model performance across different sizes (410M to 6.9B parameters) against three metrics: Brain Alignment, Formal Competence, and Functional Competence. Each graph tracks performance against token count (0-286B) with distinct color-coded model size indicators.
### Components/Axes
1. **Brain Alignment Graph**
- X-axis: Number of Tokens (0-286B)
- Y-axis: Brain Alignment (0-0.6 scale)
- Legend: Model sizes (410M, 1B, 1.4B, 2.8B, 6.9B) with color gradients
- R² values: 0.65 (left) and 0.36 (right)
- Notable annotation: "94.4% of training time" at 100B tokens
2. **Formal Competence Graph**
- X-axis: Number of Tokens (0-286B)
- Y-axis: Formal Competence (0-0.7 scale)
- Legend: Model sizes with line style variations
- Key threshold: Vertical line at 100B tokens
3. **Functional Competence Graph**
- X-axis: Number of Tokens (0-286B)
- Y-axis: Functional Competence (0-0.3 scale)
- Legend: Model sizes with blue gradient
- Vertical threshold line at 100B tokens
### Detailed Analysis
**Brain Alignment Trends**
- 410M (light green): Gradual increase with plateau at ~0.45
- 1B (green): Steeper rise to ~0.55
- 1.4B (dark green): Peaks at 0.58 before declining
- 2.8B (dotted green): Stable ~0.52
- 6.9B (solid green): Sharp peak at 100B tokens (0.58), then decline
**Formal Competence Trends**
- All models show sigmoidal growth
- 410M: Reaches 0.65 at 100B tokens
- 6.9B: Fastest ascent, plateauing at 0.72
- Post-100B tokens: Minimal improvement across models
**Functional Competence Trends**
- Linear progression for all models
- 410M: Max 0.28 at 286B tokens
- 6.9B: Reaches 0.30 at 200B tokens
- Post-100B tokens: Accelerated gains for larger models
### Key Observations
1. **Model Size Correlation**: Larger models consistently outperform smaller ones across all metrics
2. **Token Threshold Effect**: Significant performance shifts occur around 100B tokens
3. **Brain Alignment Paradox**: 6.9B model shows peak at 100B tokens followed by decline
4. **R² Discrepancy**: Brain Alignment has higher correlation (0.65) than Functional Competence (0.36)
5. **Divergent Scaling**: Formal Competence plateaus faster than Functional Competence
### Interpretation
The data suggests diminishing returns in Brain Alignment for the largest model (6.9B) beyond 100B tokens, contrasting with sustained gains in Functional Competence. This implies architectural limitations in neural alignment mechanisms at extreme scale. The 94.4% training time marker at 100B tokens indicates a critical inflection point where models achieve ~95% of their potential performance. The R² values reveal that Brain Alignment metrics better capture model capabilities than Functional Competence measures, possibly due to more direct neural correlation metrics. The consistent performance across all metrics for models above 1.4B suggests diminishing returns in parameter scaling beyond this threshold.