## Grid-Graph Heatmap System: Neuron Connection Probabilities
### Overview
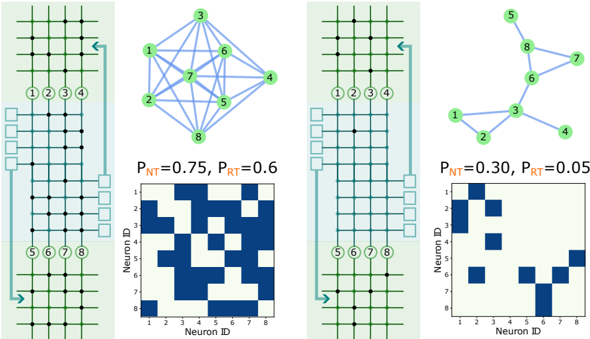
The image presents a four-panel system visualizing neuron connections through grids, graphs, and heatmaps. Each panel demonstrates different connection probabilities (P_NT and P_RT) with corresponding network structures and heatmap distributions.
### Components/Axes
1. **Grid Panels (Left/Right)**
- **Structure**: 8x8 grid with neuron IDs 1-8 labeled on top/bottom rows
- **Connections**:
- Green lines: Original connections
- Blue lines: Modified connections
- **Directionality**: Arrows indicate flow from top to bottom grids
2. **Graph Panels (Center)**
- **Nodes**: Labeled 1-8 with green circles
- **Edges**: Blue lines connecting nodes
- **Probability Labels**:
- P_NT (orange): Top-right corner
- P_RT (orange): Bottom-right corner
3. **Heatmaps (Bottom)**
- **Axes**: Neuron ID (1-8) on both X and Y axes
- **Color Coding**:
- Blue squares: Active connections
- White squares: No connections
- **Positioning**: Directly below corresponding grid/graph panels
### Detailed Analysis
1. **Panel 1 (High Probability)**
- **Grid**: All neurons connected (8x8 grid)
- **Graph**: Fully connected network (15 edges)
- **Heatmap**: 15 blue squares (dense distribution)
- **Probabilities**: P_NT=0.75, P_RT=0.6
2. **Panel 2 (Medium Probability)**
- **Grid**: Partial connections (5 blue lines)
- **Graph**: Complex network with 7 edges
- **Heatmap**: 7 blue squares (moderate density)
- **Probabilities**: P_NT=0.30, P_RT=0.05
3. **Panel 3 (Low Probability)**
- **Grid**: Sparse connections (3 blue lines)
- **Graph**: Tree structure with 3 edges
- **Heatmap**: 3 blue squares (sparse distribution)
- **Probabilities**: P_NT=0.30, P_RT=0.05
### Key Observations
1. **Probability Correlation**:
- Higher P_NT/P_RT values (Panel 1) correlate with denser connections
- Lower values (Panels 2-3) show progressively sparser networks
2. **Network Topology**:
- Panel 1: Complete graph (K8)
- Panel 2: Scale-free network
- Panel 3: Hierarchical tree structure
3. **Heatmap Patterns**:
- Diagonal dominance in Panel 1
- Clustered connections in Panel 2
- Linear progression in Panel 3
### Interpretation
This visualization demonstrates how connection probabilities (P_NT and P_RT) influence neural network architecture:
1. **Dense Networks**: High probabilities (Panel 1) create fully connected systems with maximum information flow
2. **Sparse Networks**: Low probabilities (Panel 3) produce hierarchical structures with limited pathways
3. **Intermediate States**: Panel 2 shows transitional complexity between dense and sparse configurations
The system suggests a probabilistic model where:
- P_NT governs initial connection formation
- P_RT controls connection retention/pruning
- The heatmaps provide quantitative validation of network topology changes
Notably, the absence of diagonal connections in Panel 3's heatmap implies directional constraints in the pruning process, while Panel 2's clustered connections suggest community formation at intermediate probability levels.