## Bar Chart: RMS Error vs. iSNR for Different Noise Reduction Methods
### Overview
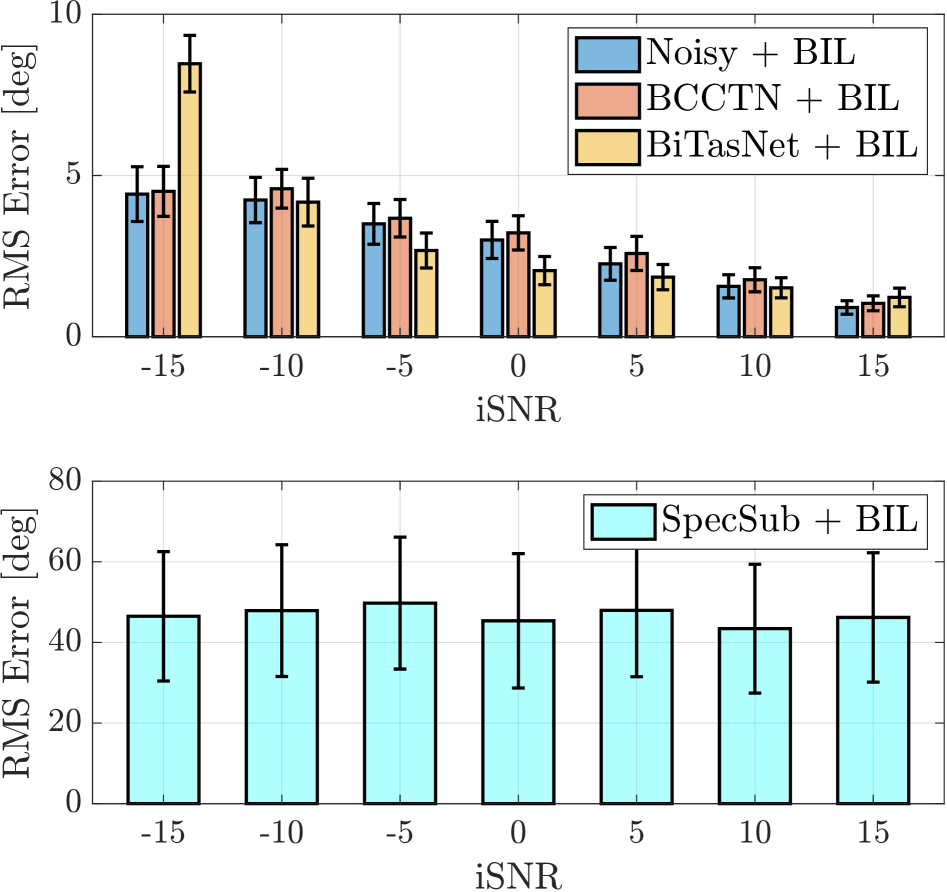
The image presents two bar charts comparing the Root Mean Square (RMS) Error in degrees ([deg]) against the input Signal-to-Noise Ratio (iSNR) for different noise reduction methods. The top chart compares "Noisy + BIL", "BCCTN + BIL", and "BiTasNet + BIL", while the bottom chart shows "SpecSub + BIL". Error bars are included on each bar, indicating variability.
### Components/Axes
**Top Chart:**
* **Y-axis:** RMS Error [deg], ranging from 0 to 10.
* **X-axis:** iSNR, with values -15, -10, -5, 0, 5, 10, and 15.
* **Legend (Top-Right):**
* Blue: Noisy + BIL
* Red-Orange: BCCTN + BIL
* Yellow-Orange: BiTasNet + BIL
**Bottom Chart:**
* **Y-axis:** RMS Error [deg], ranging from 0 to 80.
* **X-axis:** iSNR, with values -15, -10, -5, 0, 5, 10, and 15.
* **Legend (Top-Right):**
* Light Blue: SpecSub + BIL
### Detailed Analysis
**Top Chart Data:**
* **Noisy + BIL (Blue):**
* iSNR -15: RMS Error ≈ 4.5 ± 0.7
* iSNR -10: RMS Error ≈ 4.2 ± 0.8
* iSNR -5: RMS Error ≈ 3.6 ± 0.6
* iSNR 0: RMS Error ≈ 3.2 ± 0.5
* iSNR 5: RMS Error ≈ 2.3 ± 0.4
* iSNR 10: RMS Error ≈ 1.7 ± 0.3
* iSNR 15: RMS Error ≈ 1.0 ± 0.2
* **Trend:** The RMS Error decreases as iSNR increases.
* **BCCTN + BIL (Red-Orange):**
* iSNR -15: RMS Error ≈ 4.5 ± 0.7
* iSNR -10: RMS Error ≈ 4.5 ± 0.5
* iSNR -5: RMS Error ≈ 3.5 ± 0.5
* iSNR 0: RMS Error ≈ 3.0 ± 0.4
* iSNR 5: RMS Error ≈ 2.2 ± 0.3
* iSNR 10: RMS Error ≈ 1.6 ± 0.3
* iSNR 15: RMS Error ≈ 1.0 ± 0.2
* **Trend:** The RMS Error decreases as iSNR increases.
* **BiTasNet + BIL (Yellow-Orange):**
* iSNR -15: RMS Error ≈ 8.2 ± 1.0
* iSNR -10: RMS Error ≈ 4.0 ± 0.6
* iSNR -5: RMS Error ≈ 2.8 ± 0.5
* iSNR 0: RMS Error ≈ 2.1 ± 0.4
* iSNR 5: RMS Error ≈ 1.8 ± 0.3
* iSNR 10: RMS Error ≈ 1.4 ± 0.2
* iSNR 15: RMS Error ≈ 1.2 ± 0.2
* **Trend:** The RMS Error decreases as iSNR increases.
**Bottom Chart Data:**
* **SpecSub + BIL (Light Blue):**
* iSNR -15: RMS Error ≈ 46 ± 16
* iSNR -10: RMS Error ≈ 48 ± 15
* iSNR -5: RMS Error ≈ 50 ± 16
* iSNR 0: RMS Error ≈ 45 ± 15
* iSNR 5: RMS Error ≈ 48 ± 17
* iSNR 10: RMS Error ≈ 43 ± 16
* iSNR 15: RMS Error ≈ 46 ± 14
* **Trend:** The RMS Error remains relatively constant across different iSNR values.
### Key Observations
* In the top chart, BiTasNet + BIL has the highest RMS error at iSNR -15, but its error decreases significantly as iSNR increases, eventually converging with the other two methods.
* For all methods in the top chart, RMS error decreases as iSNR increases.
* SpecSub + BIL in the bottom chart has significantly higher RMS error values compared to the methods in the top chart.
* The RMS error for SpecSub + BIL remains relatively constant across different iSNR values, indicating that its performance is not significantly affected by changes in iSNR.
### Interpretation
The data suggests that the noise reduction methods "Noisy + BIL", "BCCTN + BIL", and "BiTasNet + BIL" (top chart) are more effective at higher iSNR values, as indicated by the decreasing RMS error. BiTasNet + BIL initially performs worse at low iSNR but improves significantly as iSNR increases. In contrast, "SpecSub + BIL" (bottom chart) shows a consistently high RMS error, indicating that it is less effective overall and its performance is not significantly influenced by the iSNR. The error bars indicate the variability in the measurements, with SpecSub + BIL showing the largest variability.