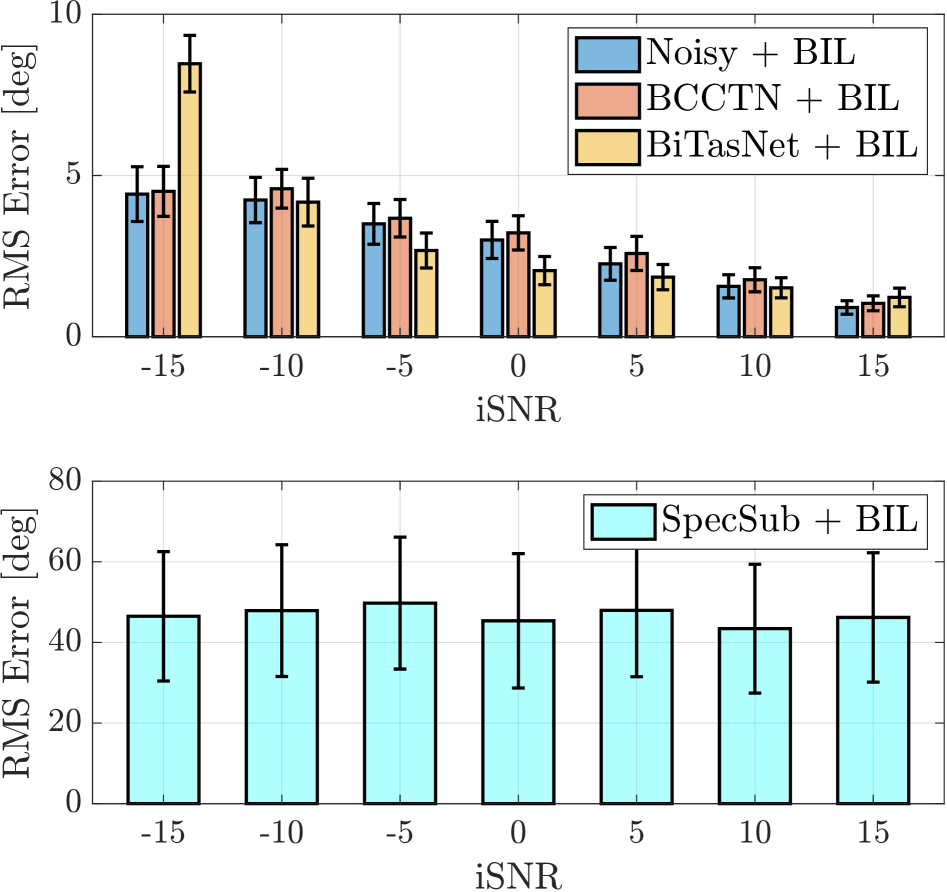
## Bar Chart: RMS Error vs. iSNR for Different Methods
### Overview
The image presents two bar charts comparing the Root Mean Square (RMS) error in degrees for different methods – Noisy + BIL, BCCTN + BIL, BiTasNet + BIL, and SpecSub + BIL – across varying input Signal-to-Noise Ratio (iSNR) levels. The top chart focuses on the first three methods, while the bottom chart displays results for SpecSub + BIL. Error bars are included, indicating the variability of the results.
### Components/Axes
* **X-axis (both charts):** iSNR (Input Signal-to-Noise Ratio), ranging from -15 to 15 in increments of 5.
* **Y-axis (top chart):** RMS Error [deg] (Root Mean Square Error in degrees), ranging from 0 to 10.
* **Y-axis (bottom chart):** RMS Error [deg] (Root Mean Square Error in degrees), ranging from 0 to 80.
* **Legend (top chart):**
* Blue: Noisy + BIL
* Orange: BCCTN + BIL
* Brown: BiTasNet + BIL
* **Legend (bottom chart):**
* Light Blue: SpecSub + BIL
### Detailed Analysis or Content Details
**Top Chart (Noisy + BIL, BCCTN + BIL, BiTasNet + BIL):**
* **Noisy + BIL (Blue):** The RMS error starts at approximately 6 degrees at iSNR = -15, decreases to around 2 degrees at iSNR = 0, and remains relatively stable around 1-2 degrees for iSNR values from 0 to 15.
* **BCCTN + BIL (Orange):** The RMS error begins at approximately 4.5 degrees at iSNR = -15, decreases to around 1.5 degrees at iSNR = 0, and remains relatively stable around 1-2 degrees for iSNR values from 0 to 15.
* **BiTasNet + BIL (Brown):** The RMS error starts at approximately 8 degrees at iSNR = -15, decreases to around 2.5 degrees at iSNR = 0, and remains relatively stable around 1.5-2.5 degrees for iSNR values from 0 to 15. The error bars are notably larger for BiTasNet + BIL at iSNR = -15.
**Bottom Chart (SpecSub + BIL):**
* **SpecSub + BIL (Light Blue):** The RMS error remains relatively constant across all iSNR levels, fluctuating between approximately 40 and 45 degrees. The error bars are consistently large, indicating significant variability.
### Key Observations
* All three methods (Noisy + BIL, BCCTN + BIL, BiTasNet + BIL) demonstrate a decreasing trend in RMS error as iSNR increases, leveling off at higher iSNR values.
* BCCTN + BIL consistently exhibits the lowest RMS error across all iSNR levels in the top chart.
* SpecSub + BIL exhibits a significantly higher and relatively constant RMS error compared to the other three methods.
* The error bars for SpecSub + BIL are consistently large, suggesting high variability in its performance.
* BiTasNet + BIL has the largest error bar at the lowest iSNR (-15), indicating the most variance in performance at low signal-to-noise ratios.
### Interpretation
The data suggests that BCCTN + BIL is the most robust method for reducing RMS error across a range of iSNR levels, consistently outperforming Noisy + BIL and BiTasNet + BIL. The performance of all three methods improves as the iSNR increases, indicating that they are all sensitive to noise. SpecSub + BIL, however, consistently exhibits a high RMS error and significant variability, suggesting it is less effective than the other methods in this context.
The consistent high error and large error bars for SpecSub + BIL could indicate that this method is fundamentally limited in its ability to handle noisy data, or that its performance is highly dependent on specific data characteristics not captured by the iSNR metric. The larger error bar for BiTasNet + BIL at iSNR = -15 suggests that this method is particularly sensitive to low signal-to-noise ratios.
The leveling off of RMS error for Noisy + BIL, BCCTN + BIL, and BiTasNet + BIL at higher iSNR values suggests that there is a limit to the improvement that can be achieved by increasing the signal-to-noise ratio. This could be due to other factors, such as limitations in the underlying algorithms or the inherent noise in the data itself.