## Scatter Plot: high_school_biology
### Overview
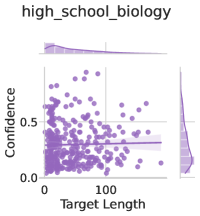
The image is a scatter plot titled "high_school_biology" with a horizontal line at approximately 0.5 confidence. The plot visualizes the relationship between "Target Length" (x-axis) and "Confidence" (y-axis), with data points distributed across the plot. Marginal histograms on the top and right edges show the distribution of target lengths and confidence levels, respectively.
### Components/Axes
- **Title**: "high_school_biology" (top of the plot).
- **X-axis**: "Target Length" (ranges from 0 to 100, with gridlines at 0, 50, 100).
- **Y-axis**: "Confidence" (ranges from 0.0 to 0.6, with gridlines at 0.0, 0.2, 0.4, 0.6).
- **Marginal Plots**:
- **Top**: Histogram of "Target Length" (x-axis distribution).
- **Right**: Histogram of "Confidence" (y-axis distribution).
- **Horizontal Line**: A dashed line at y = 0.5 (confidence level), spanning the entire x-axis range.
- **Data Points**: Purple dots scattered across the plot, with no visible legend or color key.
### Detailed Analysis
- **Data Points**:
- Approximately 50-100 purple dots are distributed across the plot.
- Most points cluster in the lower-left quadrant (low target length, high confidence).
- Fewer points appear in the upper-right quadrant (high target length, low confidence).
- **Horizontal Line**:
- Positioned at y = 0.5, suggesting a threshold or reference value for confidence.
- Approximately 30-40% of data points lie above this line, while the majority fall below.
- **Marginal Histograms**:
- **Target Length**: Peaks around 0-50, with a gradual decline toward 100.
- **Confidence**: Peaks near 0.5, with a bimodal distribution (two smaller peaks near 0.3 and 0.7).
### Key Observations
1. **Negative Correlation**: As target length increases, confidence generally decreases, though the relationship is not strictly linear.
2. **Threshold at 0.5**: The horizontal line at 0.5 confidence may represent a critical benchmark, with most data points falling below it.
3. **Distribution Patterns**:
- Target lengths are more concentrated in the lower range (0-50).
- Confidence levels are more evenly distributed but show a slight preference for mid-range values (0.3-0.7).
### Interpretation
The plot suggests that in high school biology, longer target lengths are associated with lower confidence levels. The horizontal line at 0.5 confidence could indicate a performance threshold, where half the data points fall below this level. The marginal histograms reveal that target lengths are more concentrated in shorter ranges, while confidence levels are more evenly spread. The scatter plot's lack of a clear trend implies variability in how target length affects confidence, possibly due to factors like student ability, question difficulty, or assessment design. The absence of a legend or color key limits the ability to categorize data points further, but the purple color consistently represents all observations.